Chapter 6: Diagnose Copper Test Failures
The HDTDR Analyzer
127
The HDTDR Analyzer
While return loss test results shows return loss relative to frequency,
the HDTDR
™
(High-Definition Time Domain Reflectometry) analyzer
shows return loss relative to its distance from the tester. The HDTDR
plot shows the locations and amplitudes of return loss signals to help
you find the causes of return loss failures.
After an Autotest on twisted pair cable, you can see HDTDR plot if the
Autotest had a FAIL, FAIL* or PASS* result, or if HDTDX/HDTDR on
the TEST SETUP
screen was set to All Autotests when you did the test.
For tests on coaxial cable, the HDTDR plot is always available after an
Autotest.
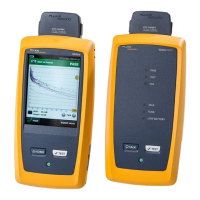
To see the HDTDR plot for an Autotest, tap the DIAGNOSTIC tab on
the Autotest results screen, then tap HDTDR ANALYZER. Figure 60
shows an example of an HDTDR plot for twisted pair cable. Figure 62
shows an HDTDR plot for coaxial cable.
Note
If Store Plot Data is off, the tester does not include
the HDTDR plot with results you save.
To get HDTDR analyzer results you can also tap Tools > Diagnostics.
Figure 61 shows how some common faults appear on HDTDR plots.
The vertical scale shows the percentage of the signal reflected
back to the main tester. The amplitudes of signals on the plot
show how much the impedance of the cabling changes.
The measurement cursor. The box at the bottom of the cursor
shows the distance from the start of the cabling to the cursor.
To measure distance, tap the yellow circle so that MARK shows,
drag the cursor to the start of the measurement, tap MARK,
then drag the cursor to the end of the measurement. See “How
to Use the Measurement Cursor on the HDTDR and HDTDX
Plot” on page 137.
The horizontal scale shows the distance along the cabling.
 Loading...
