DSX-600 CableAnalyzer
Technical Reference Handbook
128
GPU115.EPS
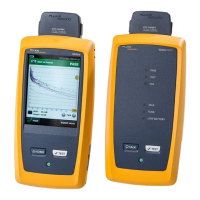
Figure 60. HDTDR Plot for Twisted Pair Cable
Tap to see help for this screen.
The Value is the percentage of the signal reflected at the
cursor’s location. If the plot shows all cable pairs, the value
shown is the largest of all the pairs.
The tester adjusts the values for insertion loss so they show the
amplitudes of the signals at the sources of the reflections.
To see the plots for individual pairs, tap or . To select
pairs to show on the plot, touch or for one second to
see the SELECT PAIRS window. Select the pairs you want to
see, then tap OK.
B
D
A
E
G
F
C
 Loading...
