GEDRAFT LOGIQ P9/P7
D
IRECTION 5604324, REVISION 11 DRAFT (JANUARY 24, 2019) SERVICE MANUAL
Chapter 5 - Components and Functions (Theory) 5-51
Graphs
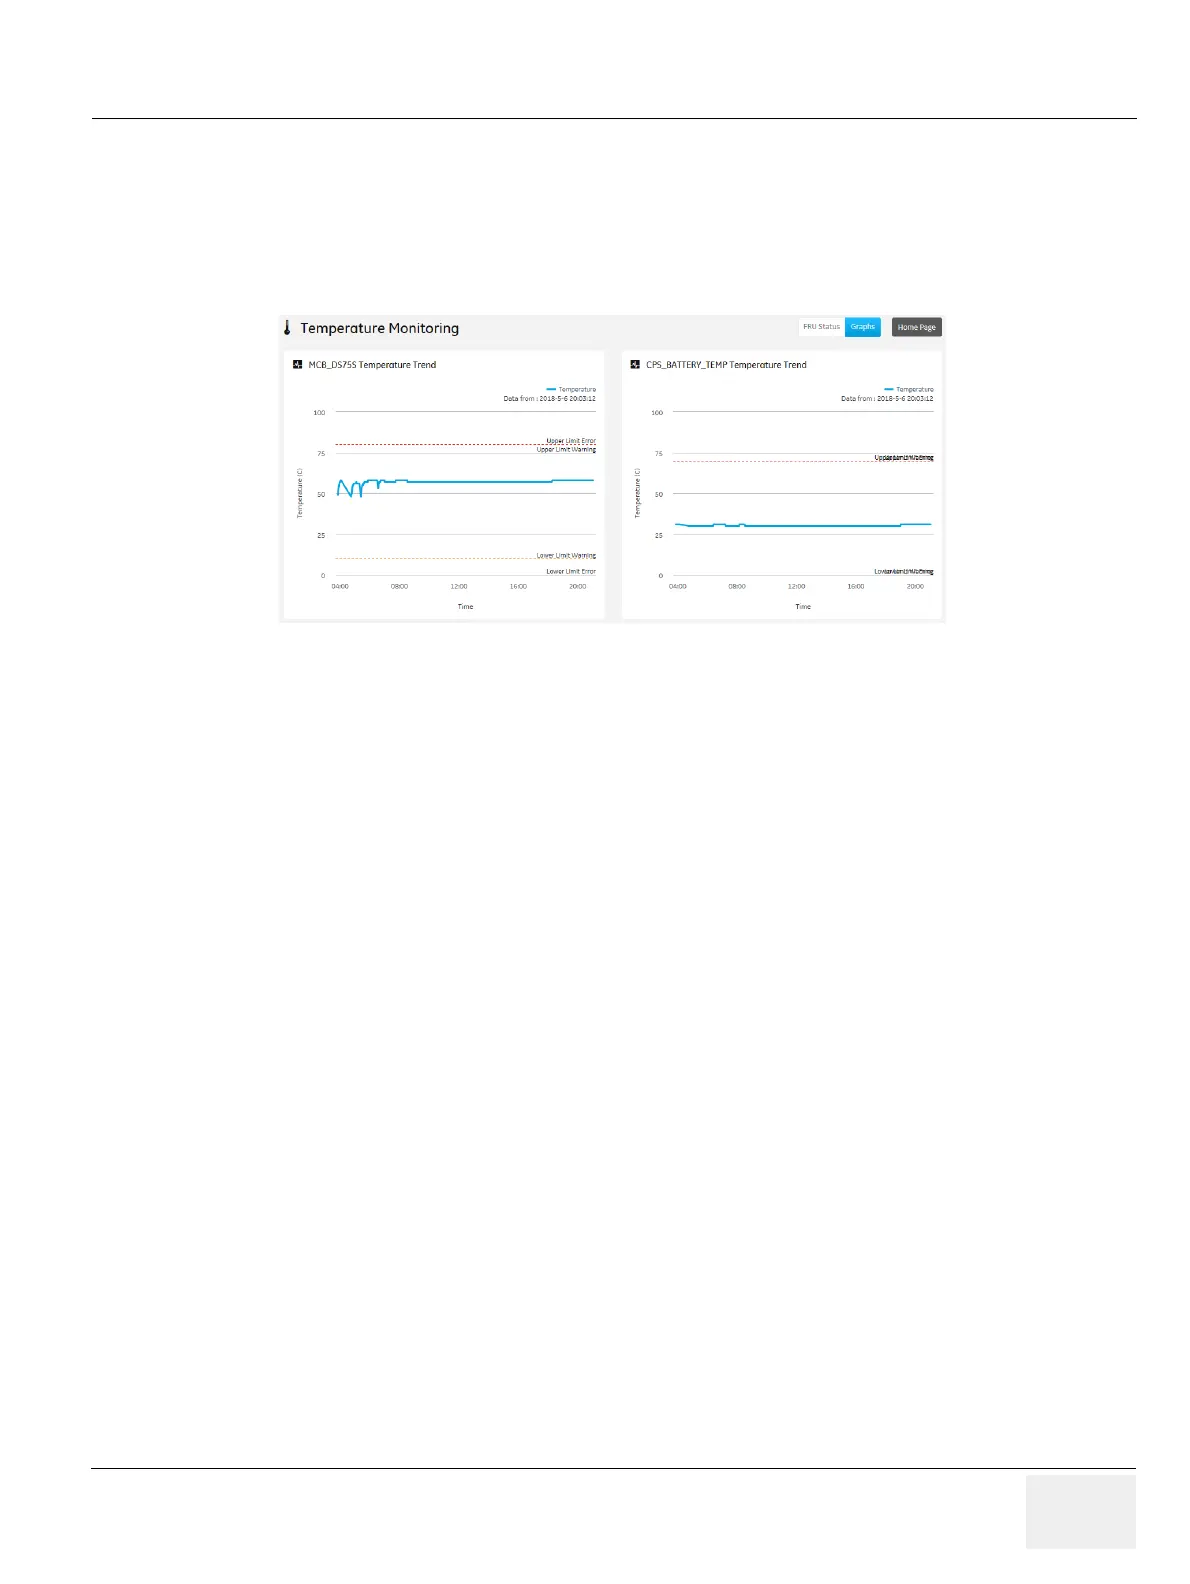
Graphs displays trend graphs for selected elements which have been selected as key indicators of
overall temperature status inside the card rack.
To access this page, under System Status, select Temperature and then select Graphs.
Figure 5-34 Graphs
For more information, see:
• Temperature on page 5-49
• Home on page 5-42
 Loading...