7.5 Displaying Flicker Values in Graph and List Form
137
Chapter 7 Monitoring Fluctuations in Measured Values
(TIME PLOT Screen)
7
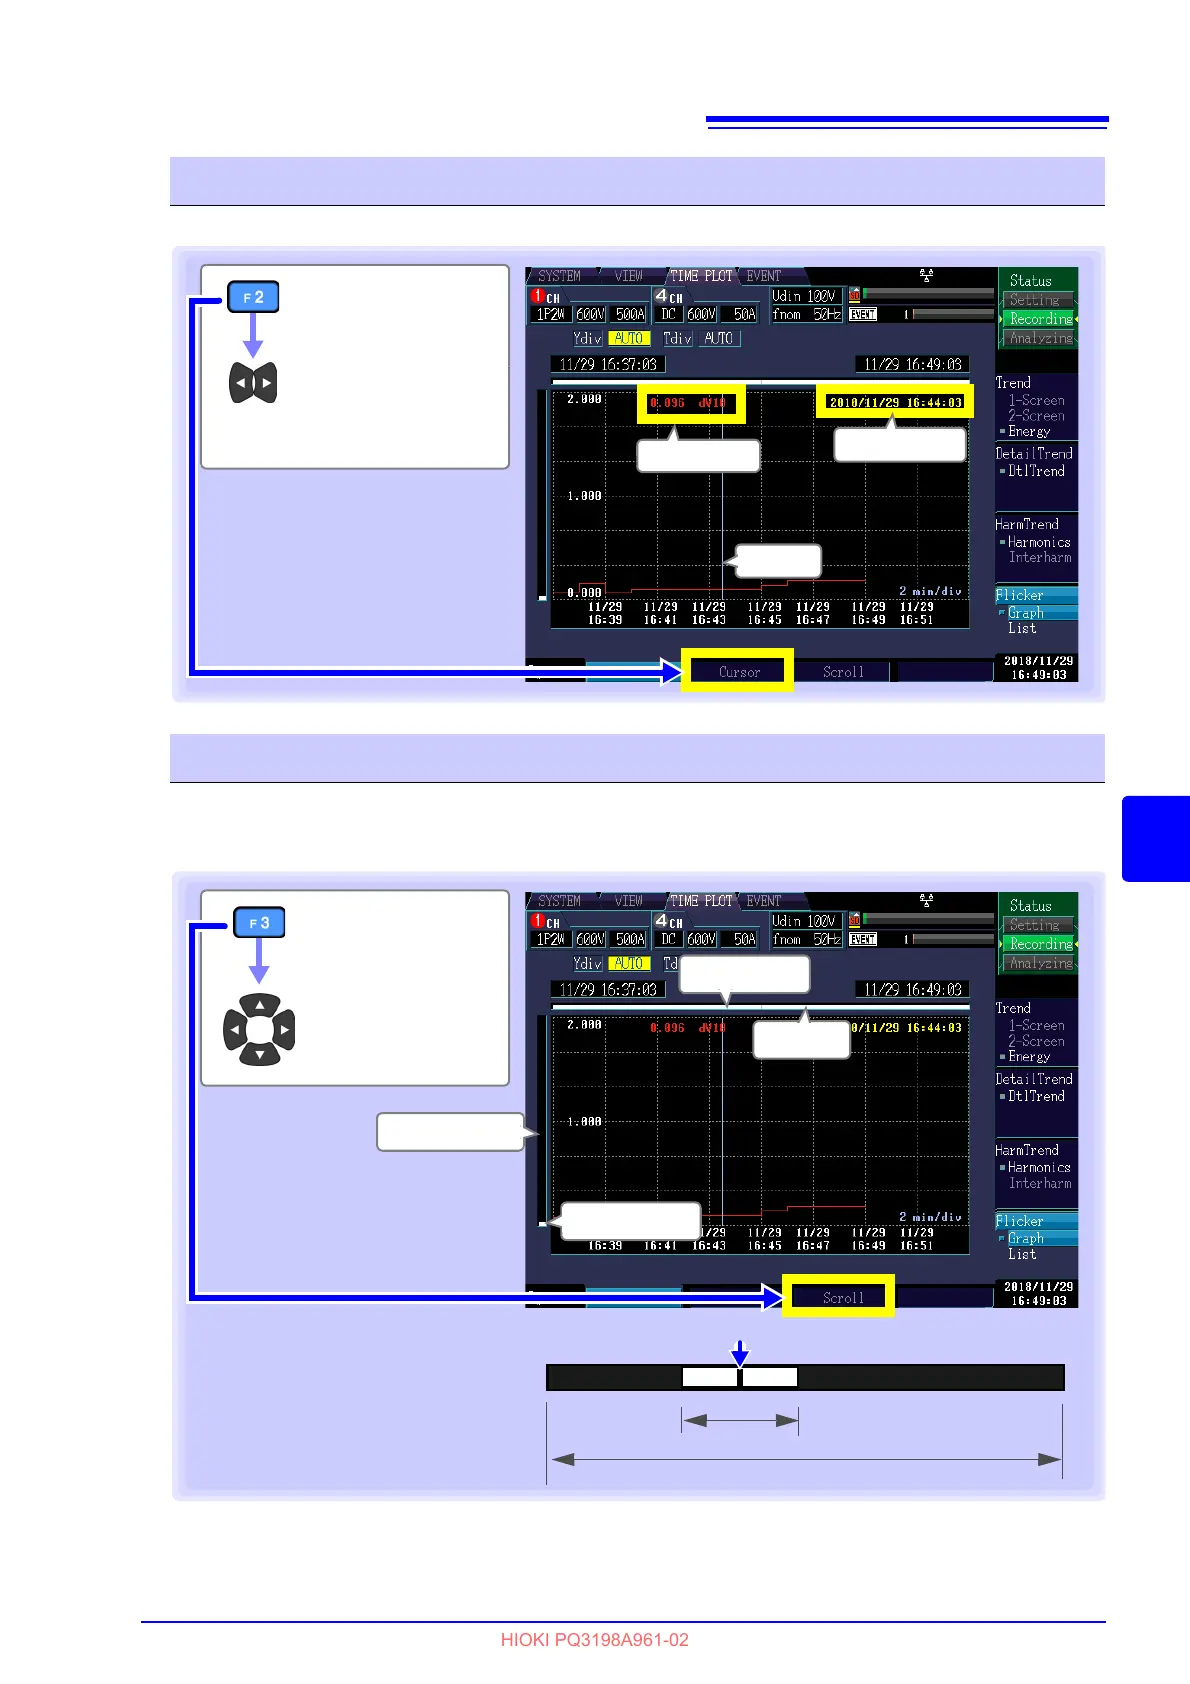
This section describes how to read the ΔV10 flicker measured value once a minute.
During recording, the X- and Y-axis are automatically scaled so that the full time series graph fits on the
screen
. Once recording has stopped and the X- and Y-axis scale has been changed so that the waveforms do
not fit on the screen, you can scroll through the time series graph by moving left, right, up, and down.
Reading the value above the cursor (Cursor measurements)
[Cursor]
Move the vertical
cursor left and
right to read the
display value.
Cursor value
Left: Measured value
Right: ΔV10
Cursor
Cursor time
Cursor value
Scrolling through waveforms
[Scroll]
Scroll through the
graph
Scroll bar
Scroll bar
Display scope
Display scope
Scroll bar
Display scope
All measurement data
Cursor position
• The display scope on the scroll bar
(shown in white) illustrates which
range of all measurement data is
being shown on the screen.
• The cursor on the scroll bar shows
where the cursor is located relative to
all measurement data.
 Loading...


