8.6 Checking Fluctuation Data
155
Chapter 8 Checking Events (EVENT screen)
8
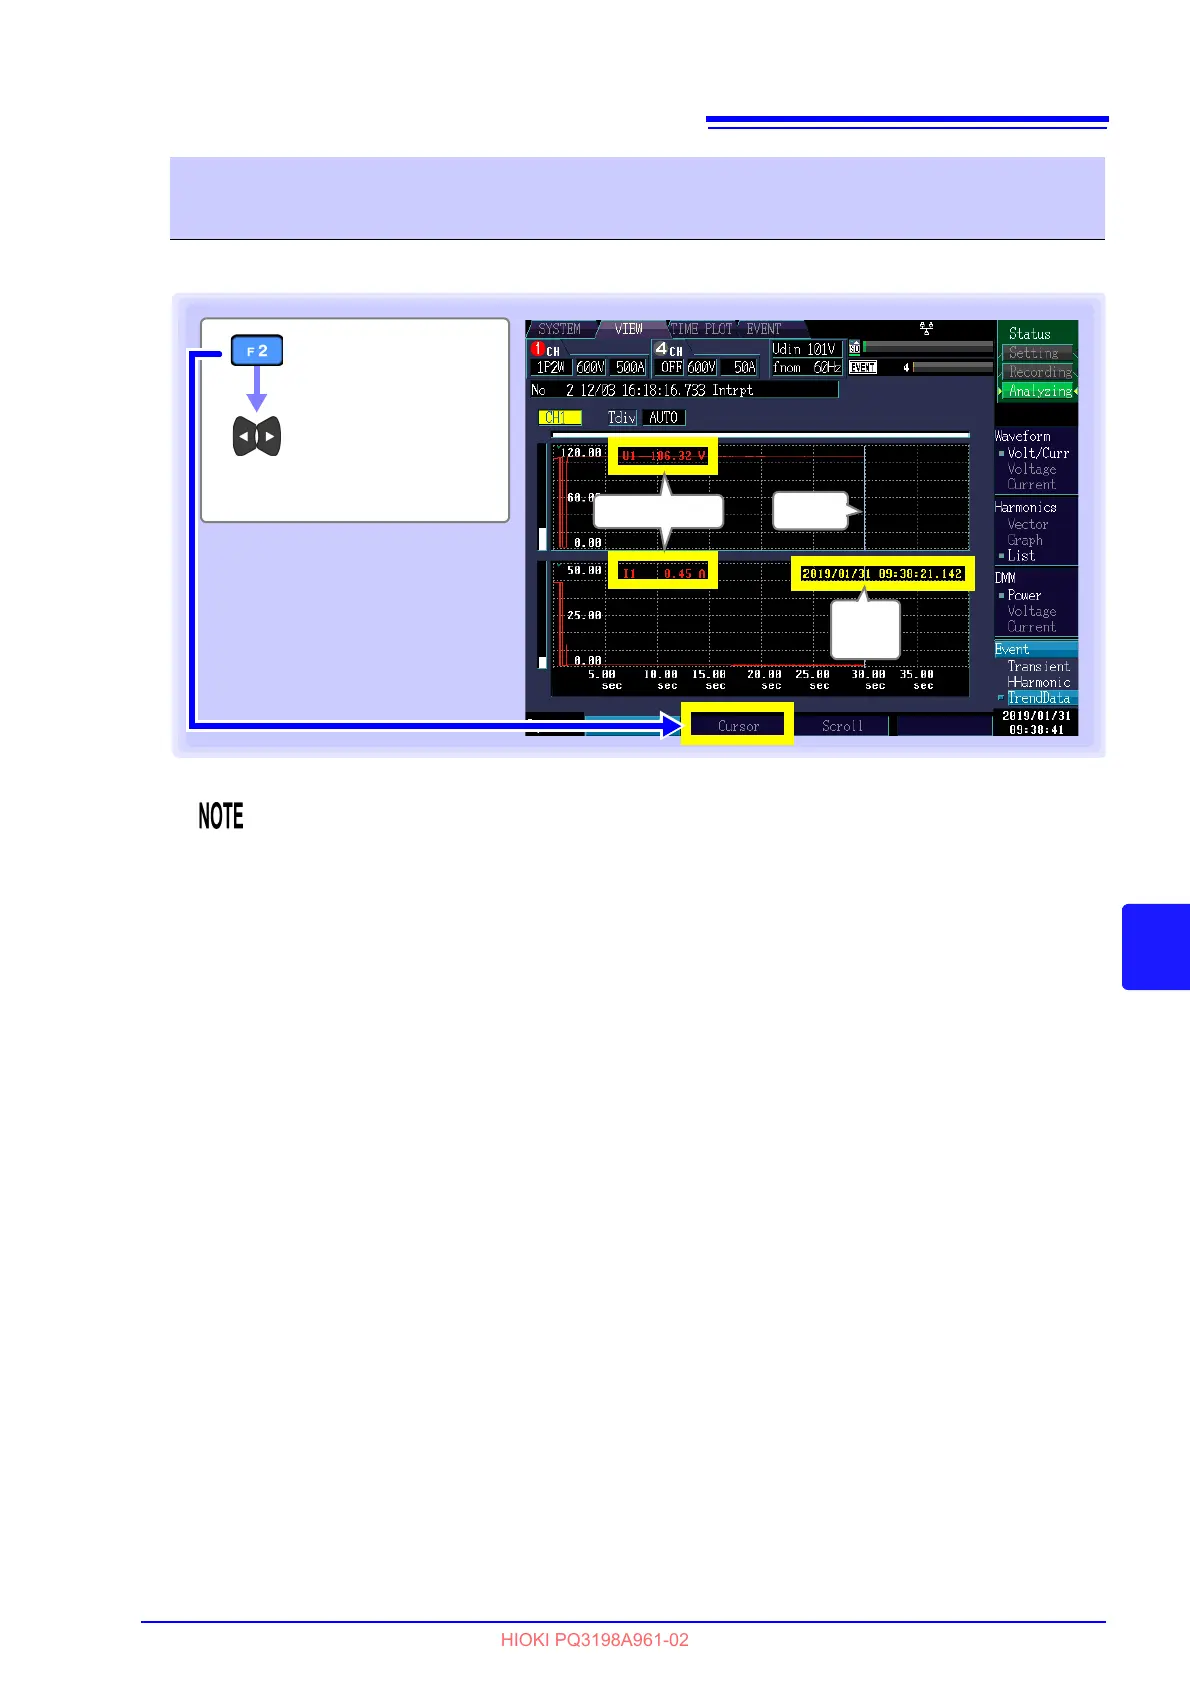
You can read the value and time at the cursor position on time series graphs.
Viewing the value and time at the cursor position (Cursor measure-
ments)
[Cursor]
Move the vertical
cursor left and
right to read the
display value.
Cursor color
Red: CH1
Yellow: CH2
Blue: CH3
Gray: CH4
Cursor
Cursor
time
Cursor value
The time displayed during cursor measurement is based on the CH1 voltage (U1). Event
occurrence times displayed in the event list and times shown during cursor measurement
may not agree.
 Loading...


