5.12 Viewing a Trend Graph
98
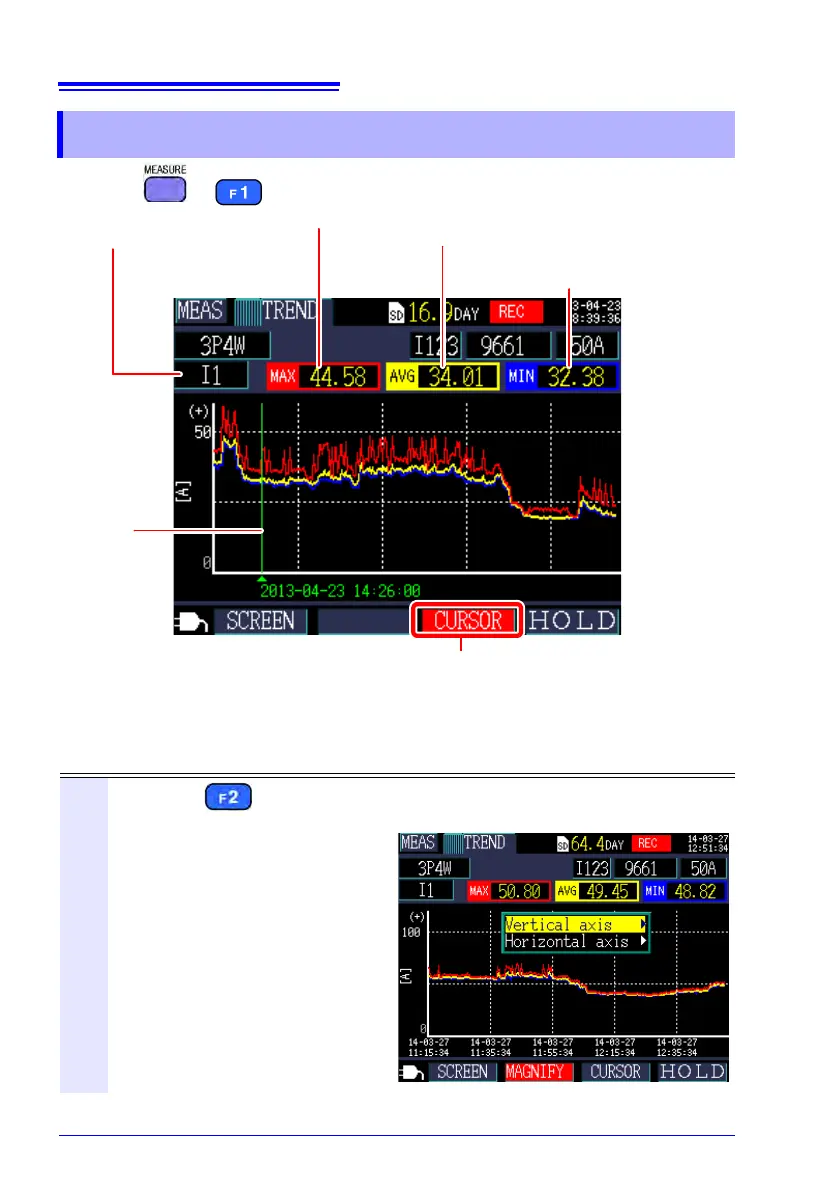
Press the or [SCREEN] key to display the [MEAS, TREND] screen.
Changing the vertical axis or horizontal axis (time axis) zoom factor
5.12 Viewing a Trend Graph
Maximum value during the save interval
Cursor
position
Switches the display
parameter.
Average value during the save interval
Minimum value during the
save interval
The cursor keys can be used to move the cursor. When the cursor is
selected, time-series display updates stop.
1
Press the [MAGNIFY] key.
The [Axis Selection] dialog box will be displayed.