5.2 List of Measurement Screens
85
Chapter 5 Viewing Measurement Data
5
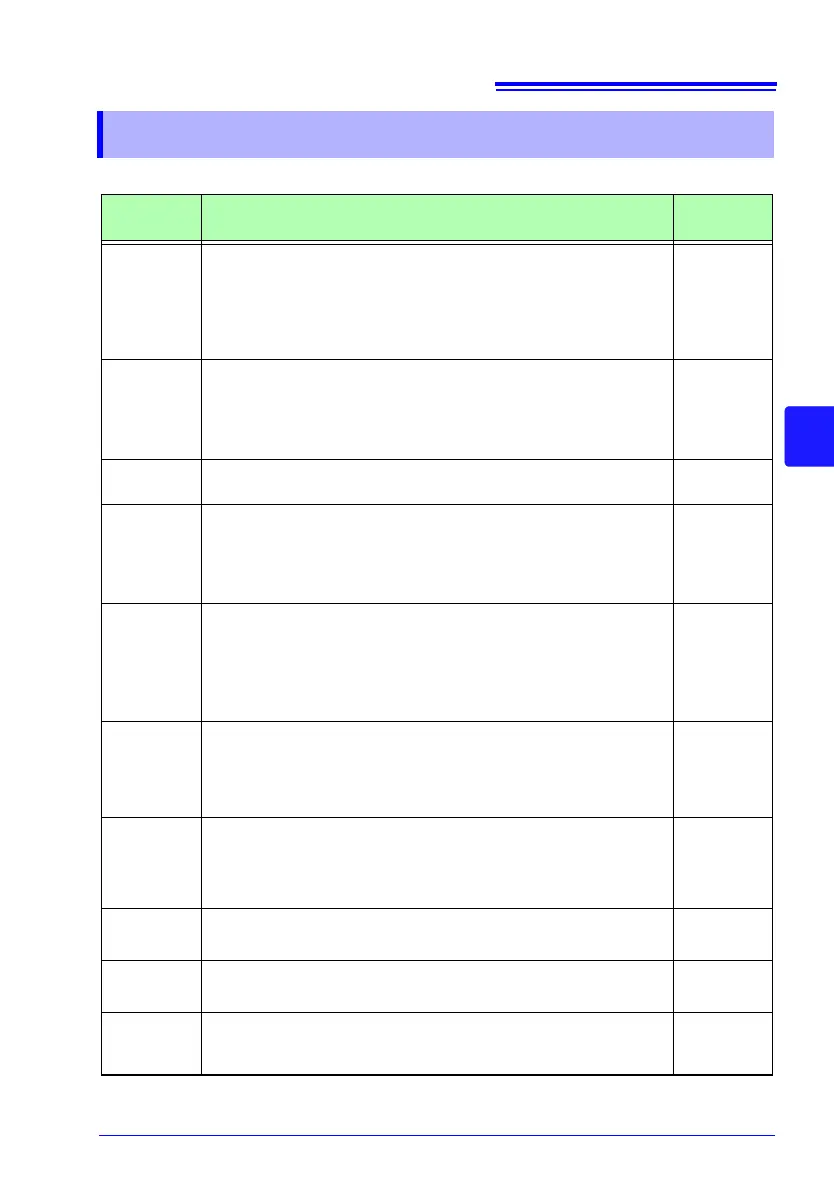
5.2 List of Measurement Screens
Screen
name
Displayed data Reference
List
Voltage RMS (U), current RMS (I), frequency (f), active power (P),
reactive power (Q), apparent power (S), power factor (PF) or dis-
placement power factor (DPF), active energy (consu
mption) WP+,
and elapsed time
(The display can be switched between two and three circuits when
us
ing a 1P2W connection.)
"5.3" (p.86)
U/I
Voltage RMS (U), voltage fundamental wave value (Ufnd), voltage
waveform peak (Upeak or Upk), voltage fundamental wave phase
angle (Udeg), current RMS (I), current fundamental wave value
(Ifnd), current waveform peak (Ipeak or Ipk), and current fundamen-
tal wave phase angle (Ideg)
"5.4" (p.87)
Power
Per-channel and total active power P, apparent power S, reactive
power Q, power factor PF or displacement power factor DPF
"5.5" (p.88)
Integ.
Active energy (consumption WP+, regeneration WP-), reactive
energy (lag WQ+, lead WQ-), recording start time, recording stop
time, elapsed time, energy cost
(The display can be switched between two and three circuits when
u
s
ing a 1P2W connection.)
"5.6" (p.89)
Demand
Can be switched to active power demand value (consumption
Pdem+, regeneration Pdem-), reactive power demand value (lag
QdemLAG, lead QdemLEAD), power factor demand value (PFdem),
or pulse input.
Maximum demand value: Displays the maximum active power
de
mand value MAX_DEM and the time at which it occurred.
"5.7" (p.90)
Harmonic
gra
ph
(PW3360-
21
o
nly)
Harmonic graph (voltage, current, active power level, content per-
centage, phase angle)
"5.8" (p.91)
Harmonic
list
(PW3360-
21 only)
Harmonic list (voltage, current, active power level, content percent-
age, phase angle)
"5.9" (p.93)
Waveform
Displays voltage and current waveforms, voltage and current RMS
values, and frequency.
"5.10"
(p.95)
Zoom
Enlarged view of 4 user-selected parameters
"5.11"
(p.97)
Trend
Displays one measurement parameter as selected by the user.
Displays the maximum, average, and minimum values and allows
c
u
rsor measurement.
"5.12"
(p.98)
 Loading...