5.7 Viewing a Demand Graph
90
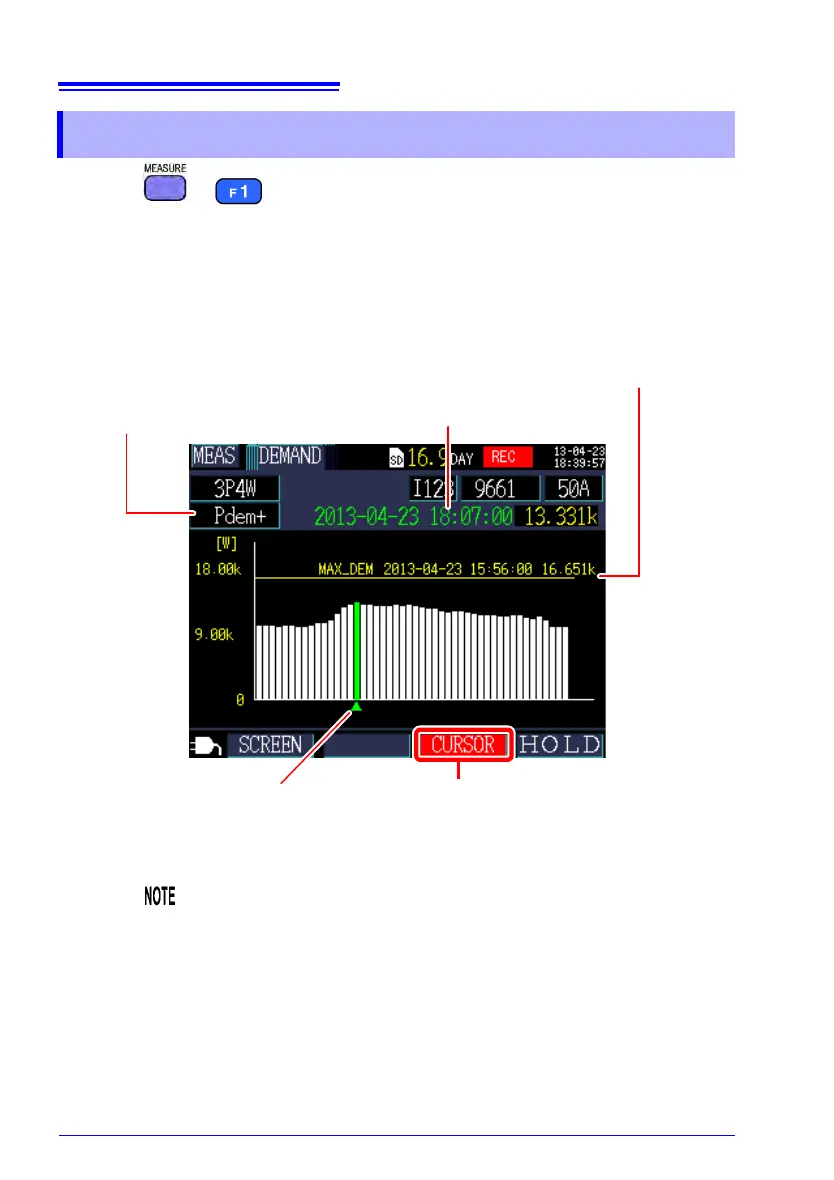
Press the or [SCREEN] key to display the [MEAS, DEMAND] screen.
The instrument stores data for up to 48 of the latest time intervals in its internal
memory for user review.
5.7 Viewing a Demand Graph
Performs cursor measurement.
The cursor keys can be used to move the cursor.
Cursor measured value
When active power demand value (con-
sumption Pdem+) is selected, displays a
line indicating the maximum active power
demand value (consumption Pdem+) and
the time and date of its occurrence.
Cursor position
Switches the display parameter.
Active power demand value (consump-
tion Pdem+, regeneration Pdem-)
Reactive power demand value
(lag QdemLAG, lead QdemLEAD)
Power factor demand value (PFdem)
Pulse input (Pulse)
• You can review data for up to 48 of the latest time intervals.
• The zoom factor for the vertical axis is set automatically. First, it
is set to 1/10, and then switched automatically to 1/5, 1/2, and 1/
1 in series according to displayed data levels.
• When using current-only wiring, the display parameter will be
fixed
to pu
lse input (Pulse).
• When measured values exceed the display range, the relevant
bars ar
e colored.