Page 22-5
The following diagram illustrates the functions available in the PPAR menu. The
letters attached to each function in the diagram are used for reference purposes
in the description of the functions shown below.
INFO (n) and PPAR (m)
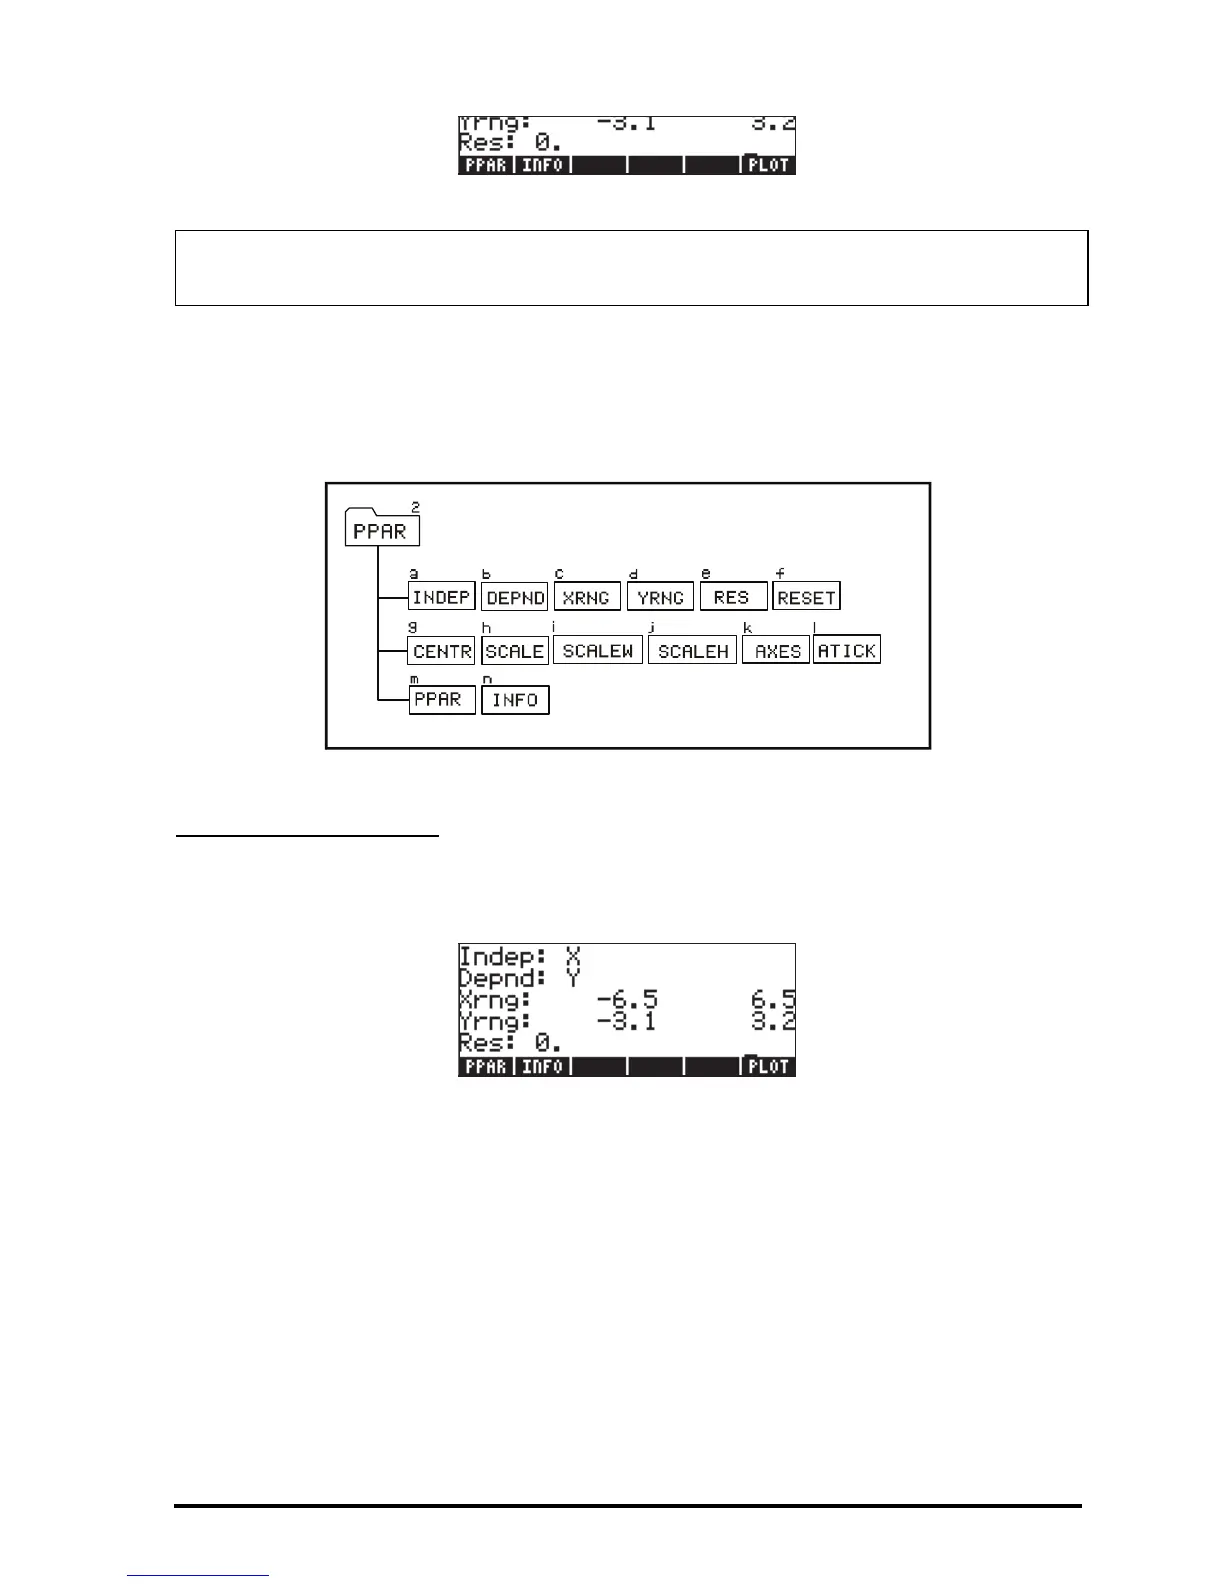
If you press @INFO, or enter ‚ @PPAR, while in this menu, you will get a listing of
the current PPAR settings, for example:
This information indicates that X is the independent variable (Indep), Y is the
dependent variable (Depnd), the x-axis range goes from –6.5 to 6.5 (Xrng), the
y-axis range goes from –3.1 to 3.2 (Yrng). The last piece of information in the
screen, the value of Res (resolution) determines the interval of the independent
variable used for generating the plot.
The soft menu key labels included in the PPAR(2) menu represent commands
that can be used in programs. These commands include:
Note: the SCALE commands shown here actually represent SCALE, SCALEW,
SCALEH, in that order.

 Loading...


