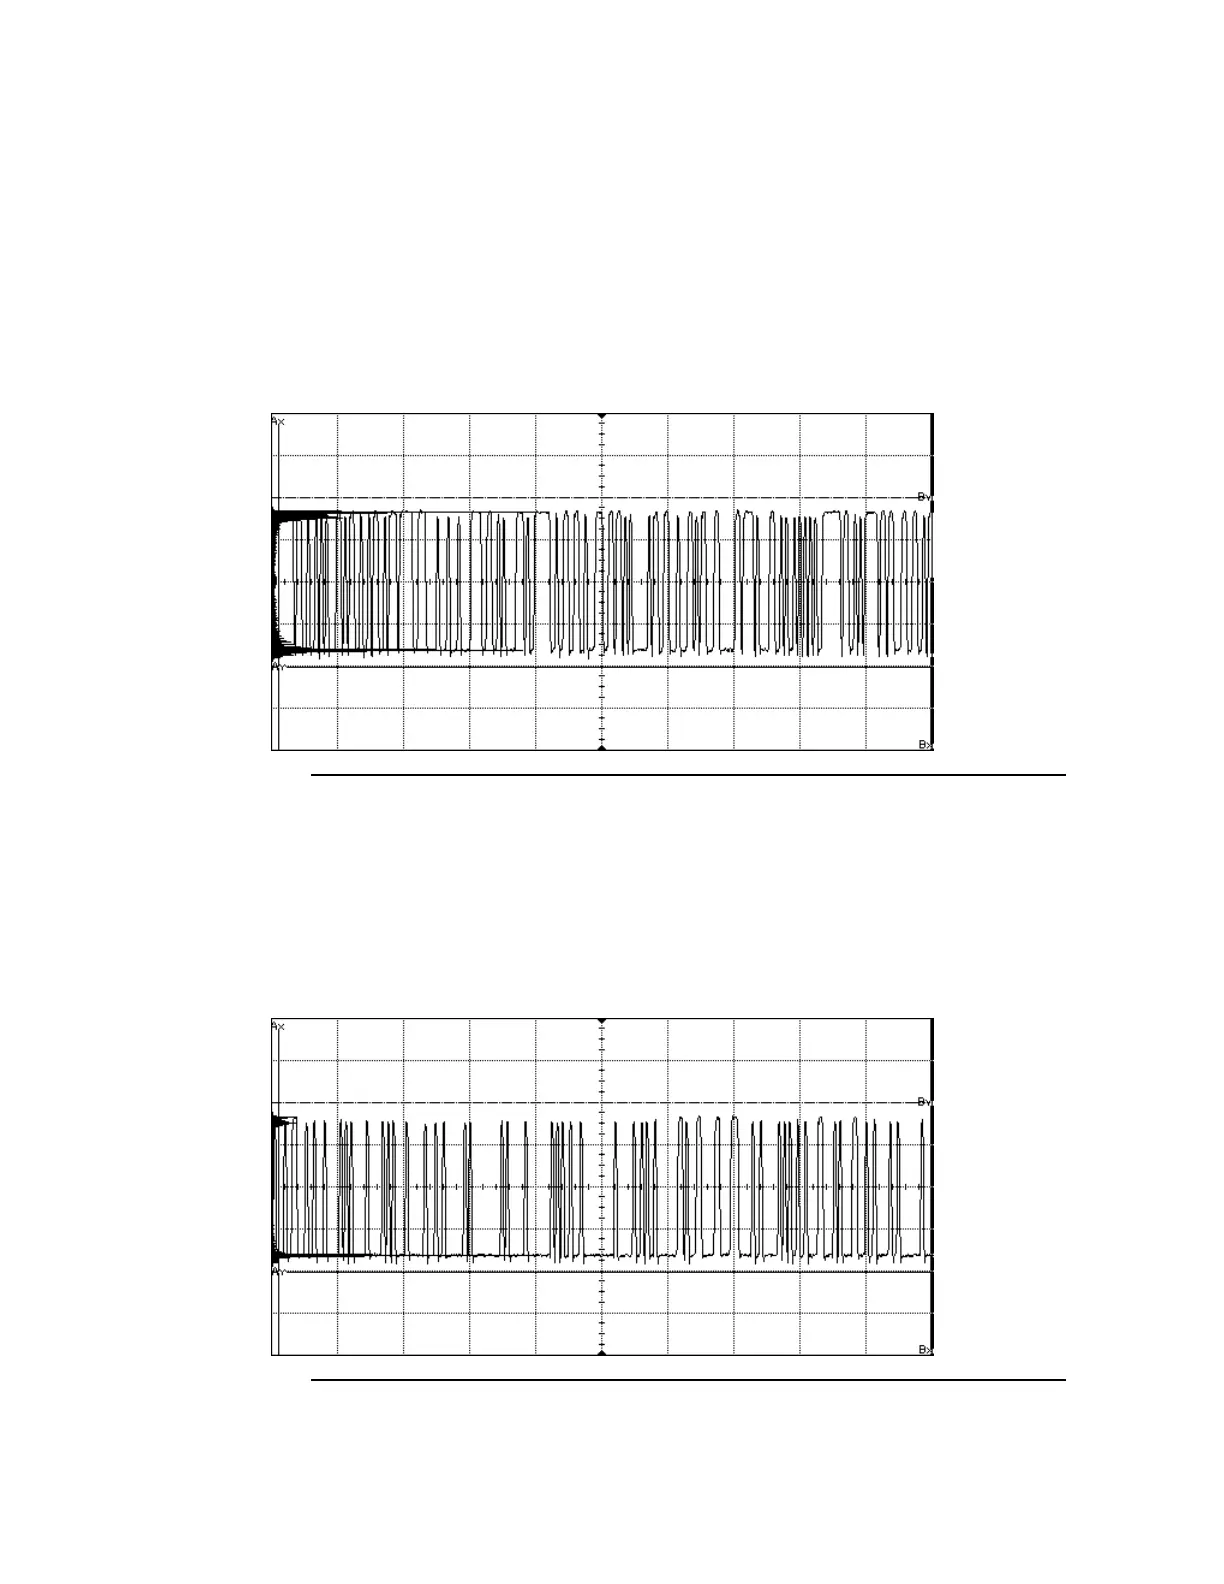
The example below shows the measured histogram of a user defined noise
distribution containing only 2 different values (square wave with 50% duty
cycle). Since the output signal cannot jump between the programmed high
and low level, it is sampled on voltage levels in between, while it is on the
transition between the high and low level. This leads to a measured
histogram that does not only contain readings at the high and low level, but
also during the transitions of the output signal.
The following example shows a user defined distribution that is a square
wave with 25% duty cycle. Due to the bandwidth limitations, the ratio
between the high and low level peaks in the histogram is not 1/3 but 1/4.
And thus the probability to see the programmed high level at the output is
less than expected.