180 Chapter 8
Measurement Theory
Time Domain Amplitude and Amplitude (dB)
Using the equation above for the linear transfer function,
H(
ω
),
the impulse response
is given by the Fourier transform of the transfer function,
h
˜
j
=
FFT
{ H( ω ) }
j
,
where
FFT
{ H( ω ) } denotes the Fast Fourier Transform of H( ω ) . The index j
indicates the location in the data array, and corresponds to time.
The Amplitude (dB) curve is the time domain linear amplitude data plotted on a
log scale, according to the following relation:
Amp[ d
B
]
j
=
10
log
[ h
˜
j
] .
8
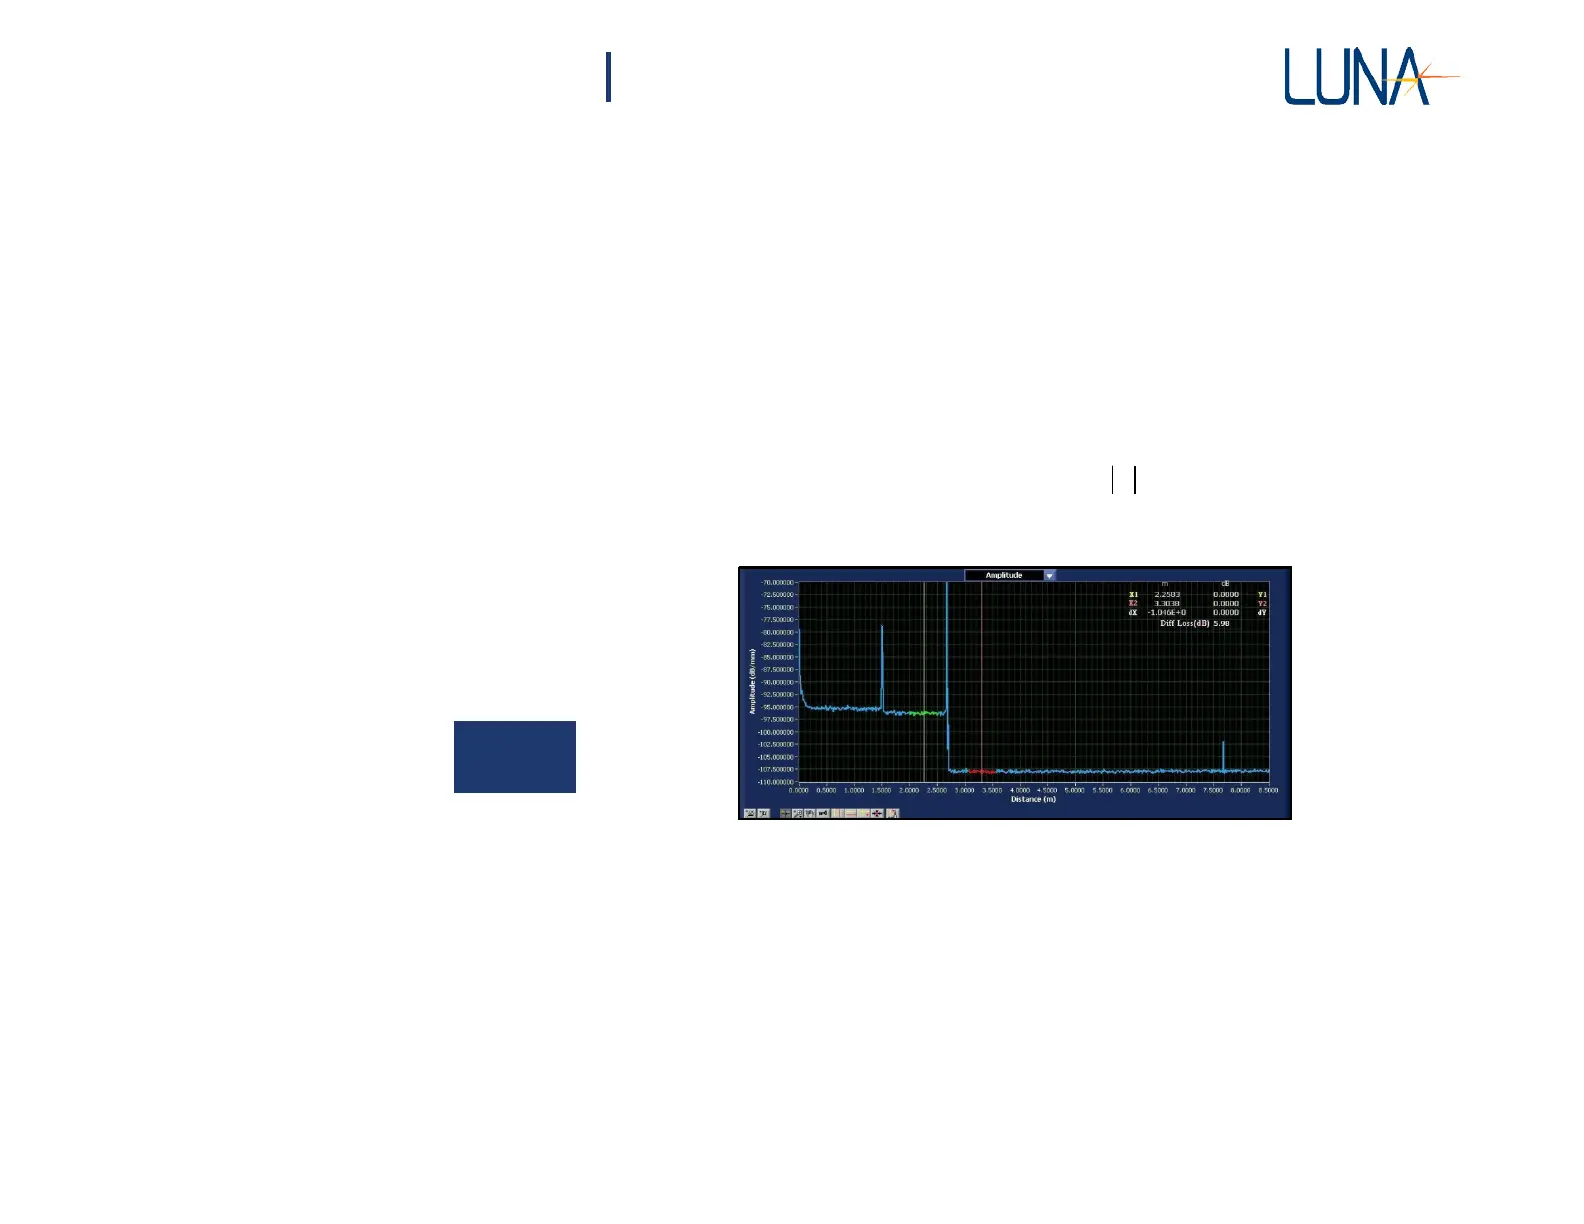
Figure 8-4. Time domain Amplitude data for a switch.
Note that Amplitude has units of dB/mm, as seen above, while Amplitude (dB)
has units of
dB.
The Amplitude curve is the time domain Linear Amplitude (see below),
normalized by the number of data points in 1 millimeter, converted to a log scale.
The number of data points in 1mm is dependent on the Start, End and Wavelength
Range of the Scan. Thus, displaying the time domain Amplitude in these units
allows for easy comparison between data sets taken using different wavelengths,
since the nominal scatter level expressed in dB/mm remains constant.