Optical Backscatter Reflectometer 4600 181
User Guide
Time Domain Linear Amplitude
The linear amplitude is the h
˜
j
plotted on a linear scale.
Figure 8-5. Time domain Linear Amplitude data for a switch.
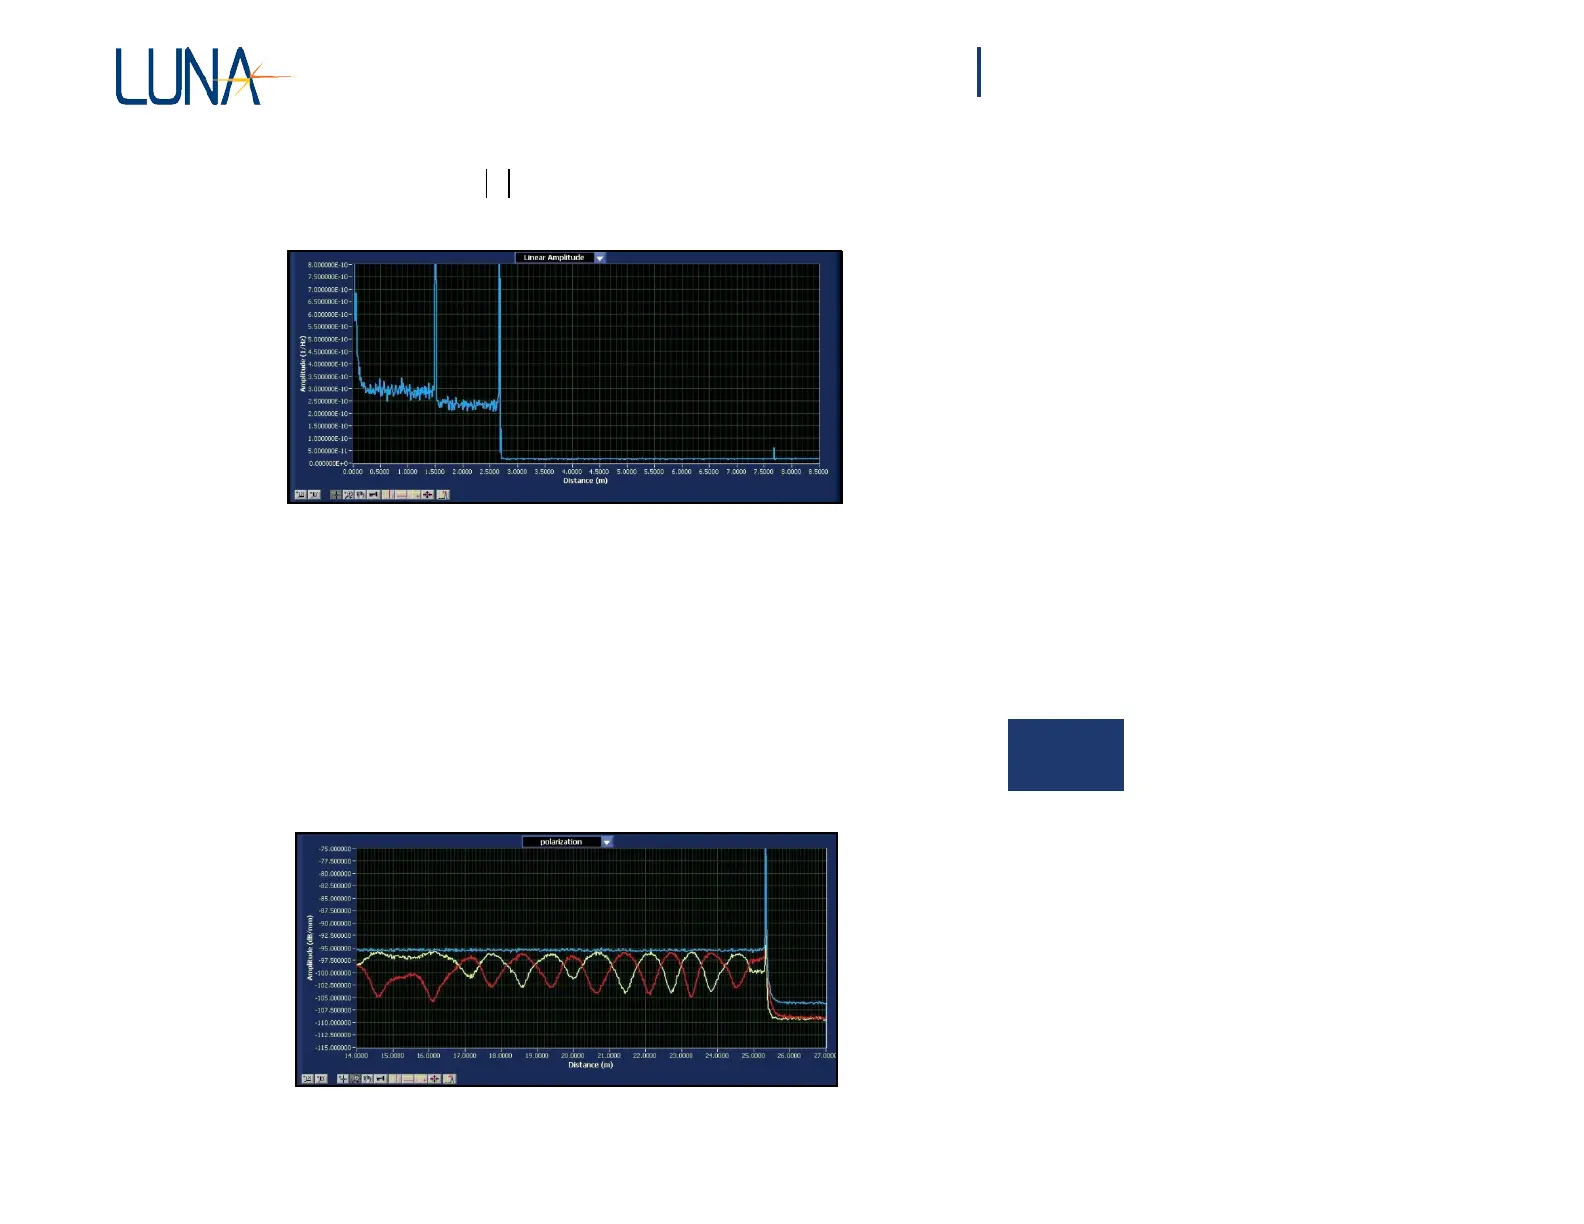
Time Domain Polarization States
The OBR detects the power returned in two orthogonal polarization states. The
power in these two states can be summed to form the total power returned from a
particular location in the fiber. This summation is the blue curve displayed in the
linear and logarithmic amplitude plots. (See Figure 8-6 below.) In some cases,
particularly where birefringence is present, it is useful to look at the power returned
in each of the polarization states. The polarization graph shows these two power
levels in red and yellow, as well as the sum of the powers in blue.
Figure 8-6. Polarization data on spooled fiber.
 Loading...

