26 Chapter 3
Software Guide
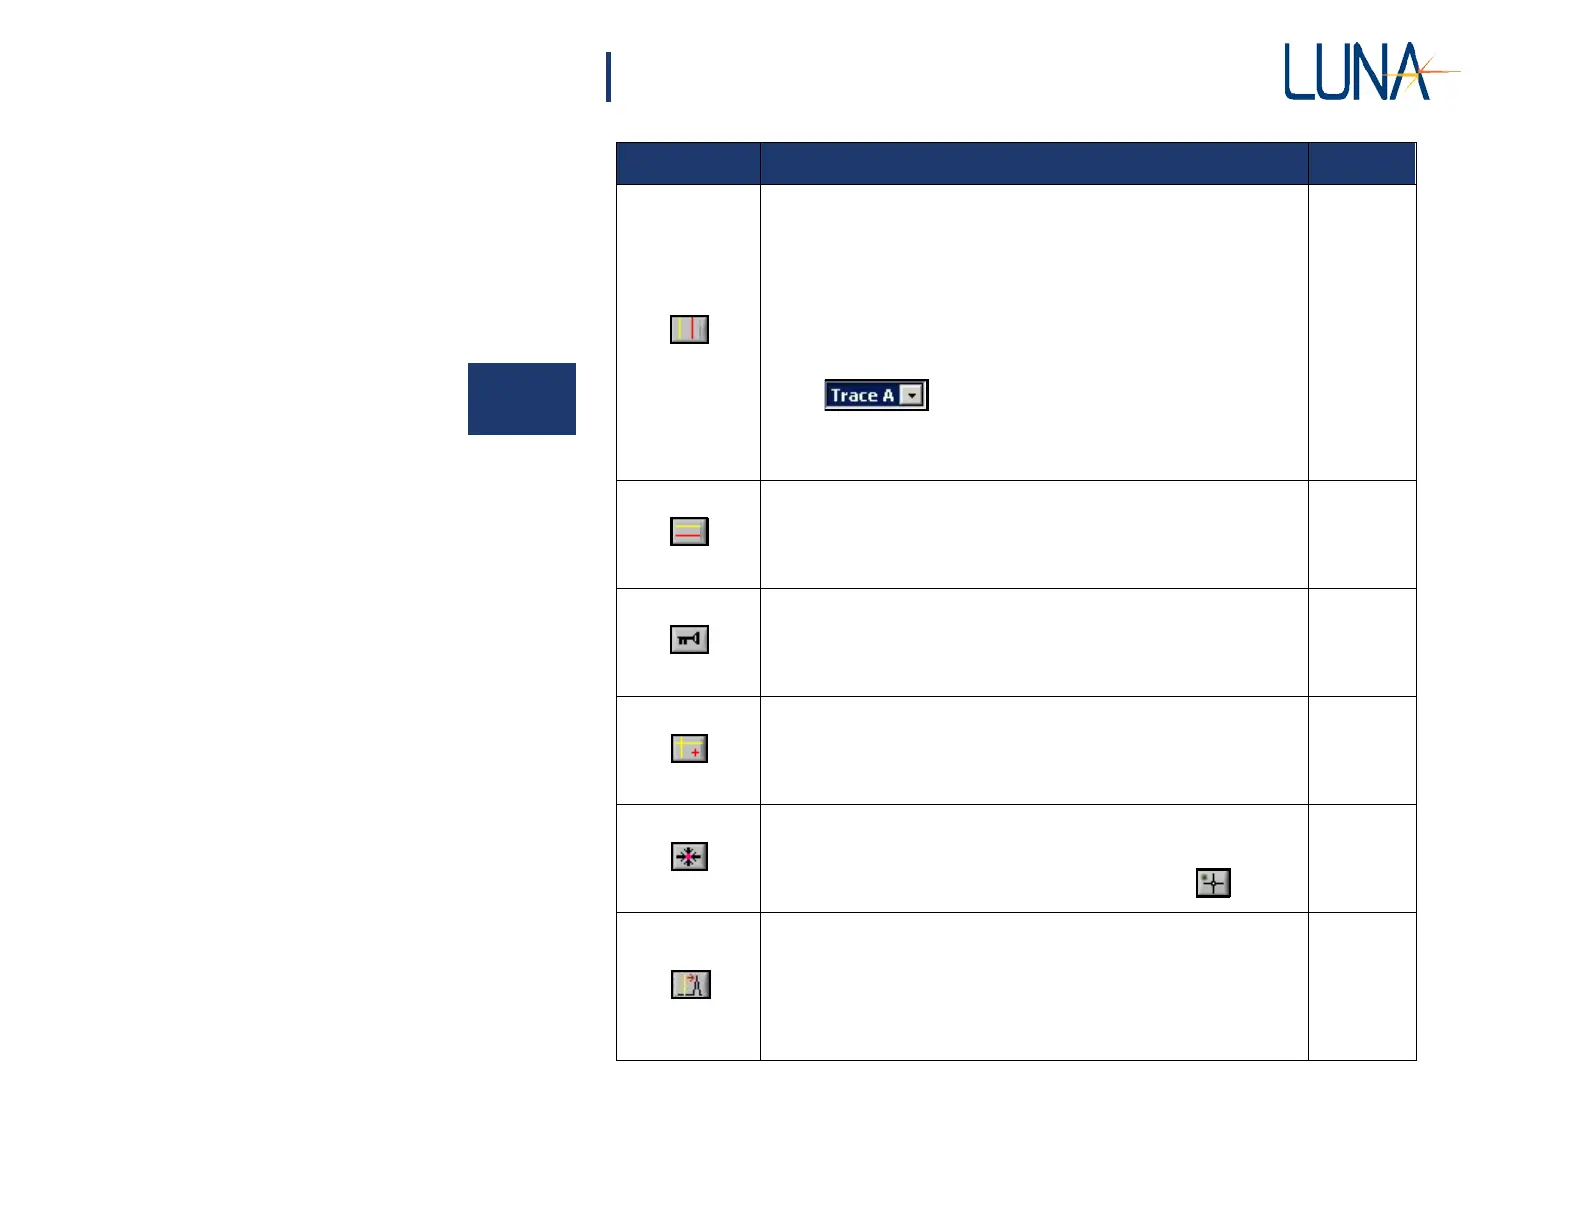
Button
Description
Page
Toggles two vertical cursor lines on or off. Note that when these
cursors are on in the upper graph, differential and return loss are
calculated and displayed in the upper right legend. Also, the data
points integrated to calculate loss are highlighted in contrasting
colors.
By default, with all cursor buttons, cursors are attached to Trace
A. The user may attach them to another trace using the pull-down
menu at the upper left corner of the graph.
Note that with all the cursors, the X- and Y-coordinates are
displayed in the upper right of the graph when any cursors are on.
73
Toggles two horizontal cursor lines on or off.
73
Toggles the plot legend on or off. The color, style, and width of a
line may be changed in a menu accessed by clicking within the
legend. (See “Changing graph style and color” on page 74.)
74
Toggles twin locked cursor on and off. Regardless of where these
cursors are dragged, they will intersect the first graph at a data
point.
73
Brings cursors into the viewed portion of the graph. By default,
cursors appear at 10% and 90% of the X- or Y-axis range. They
may be dragged by selecting the cross-hair cursor, .
73
Moves the vertical cursors to the peak of the regions highlighted.
This control only works properly with vertical cursors, when
Options > Cursors > Show Integration Area is enabled
(checked) [When Options > Sensing Enabled is on, this menu
item becomes Options > Cursors > Show Sensing Area. See
“Distributed Sensing Measurements” on page 48.]
73
3