56 Chapter 4
Performing Measurements
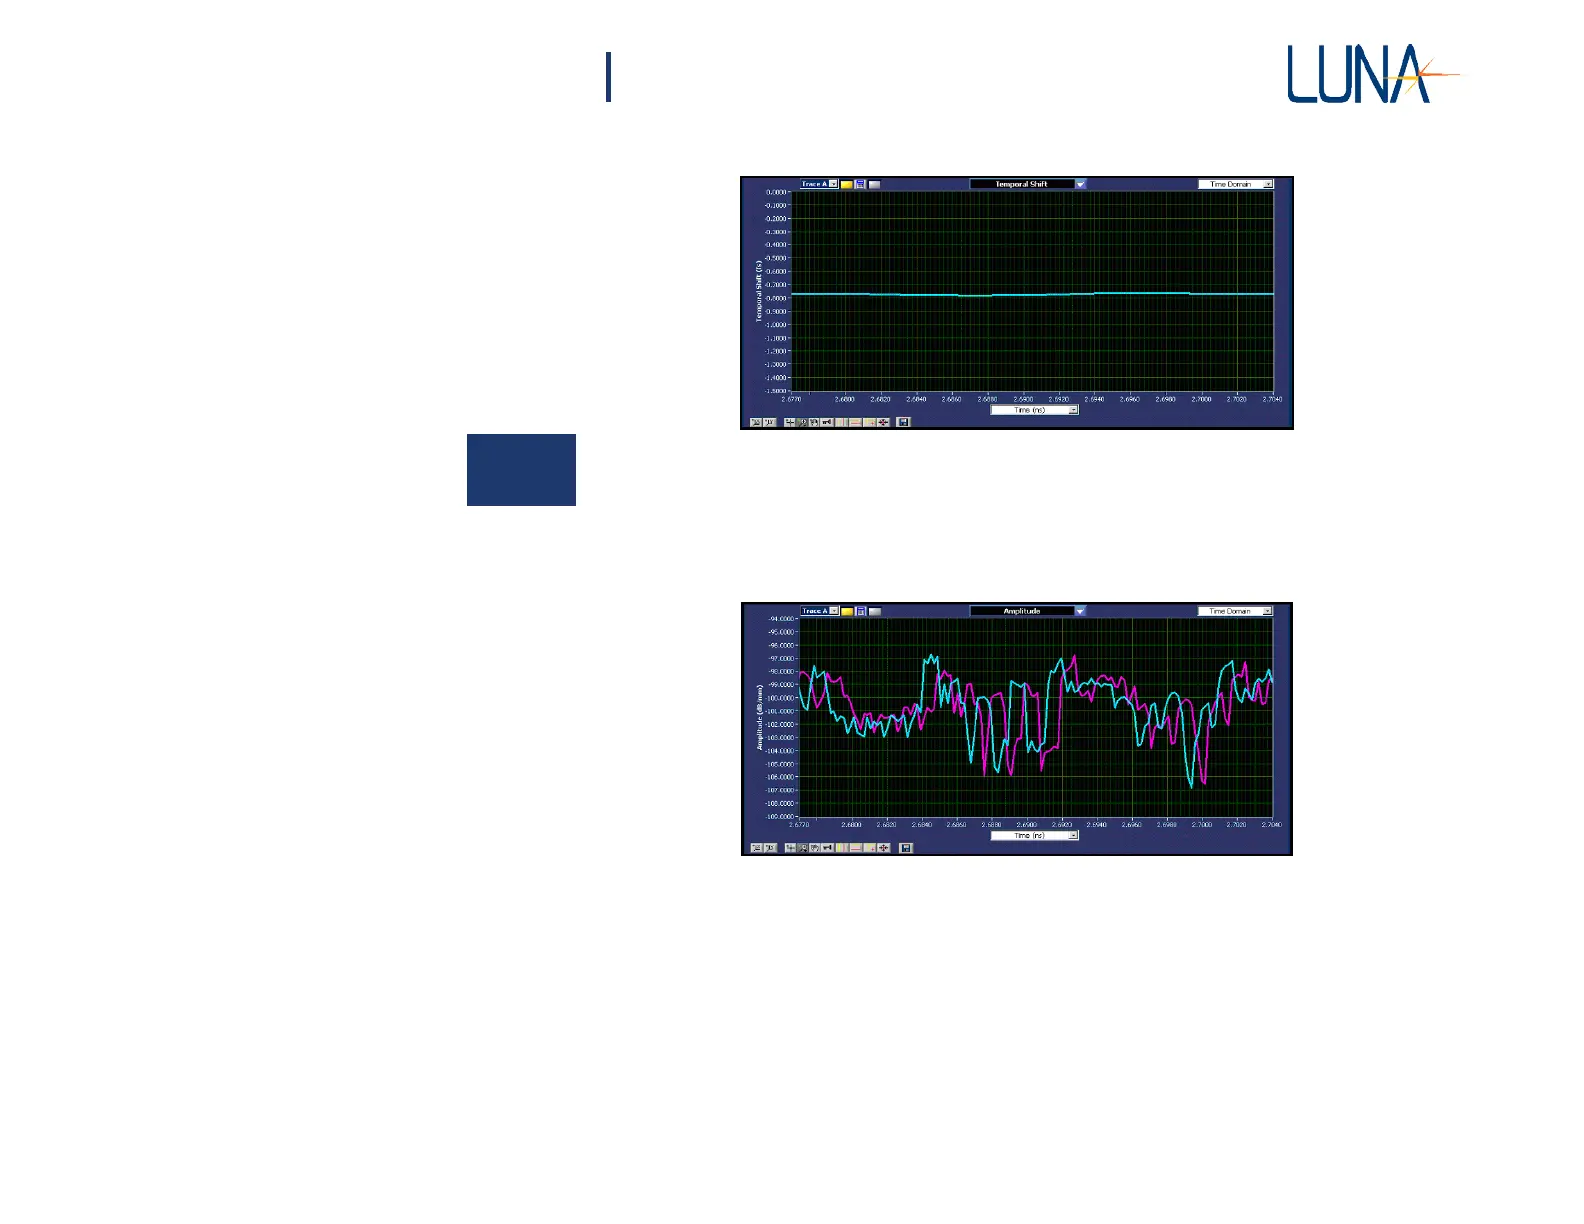
Figure 4-11. Results of the cross correlation calculation for a section of the FUT in
Figure 4-9, which shows roughly -0.8 fs Temporal Shift between perturbed
and the Shift Reference, Trace E.
Trace A
Figure 4-12. The reflection Amplitude for the same temporal range as in Figure 4-
11 for Trace A (blue) is shifted by roughly -0.8 fs to the left of the Shift
Reference, Trace E (purpl
e).
The spectral shift and temporal shift for the same segment of fiber over which a
constant strain is applied are shown in Figures 4-13 and 4-15. These plots illustrate
that the temporal shift is a scaled integral of the spectral shift: where the spectral
shift is zero, the temporal shift curve is flat, and where the spectral shift is large
and steady, the temporal shift curve shows a steady upward slope.