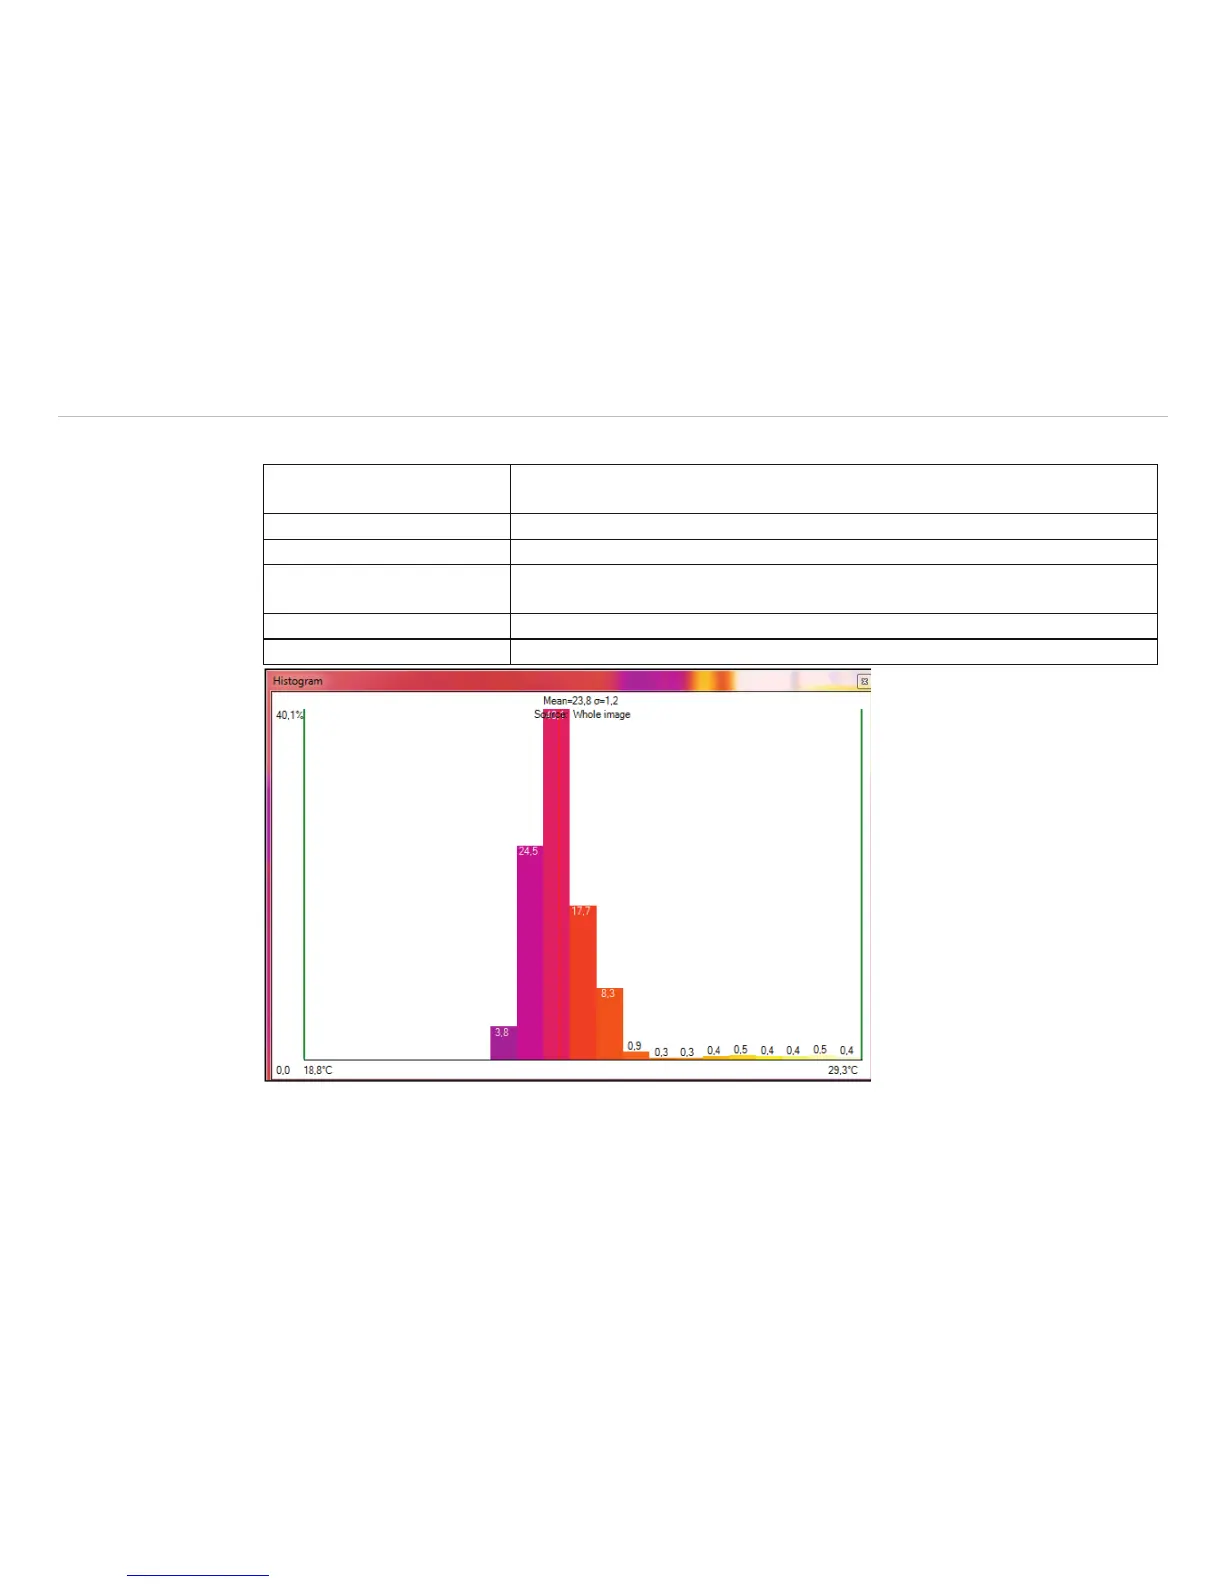
Further options are:
Current temperature If activated the red line will show the current temperature at the mouse in the
graph.
Mean and sigma value Average temperature and statistical deviation 1 s (1 Sigma) will be displayed.
Source Shows on what source the histogram is related to.
Values (wenn genug Platz) The current values of the single palette colors are shown, but it needs a
certain window size to illustrate them on the graph.
Use palette colors You can choose between colored or black/white presentation.
Step size Shows the width of the bar in °C or °F.
Fig. 83 Histogram with the view of current temperature, mean and sigma values, Source, Values, Use palette
colors and step size (here: 0.5 °C)