6.3.2 Scaling of Diagram Axes
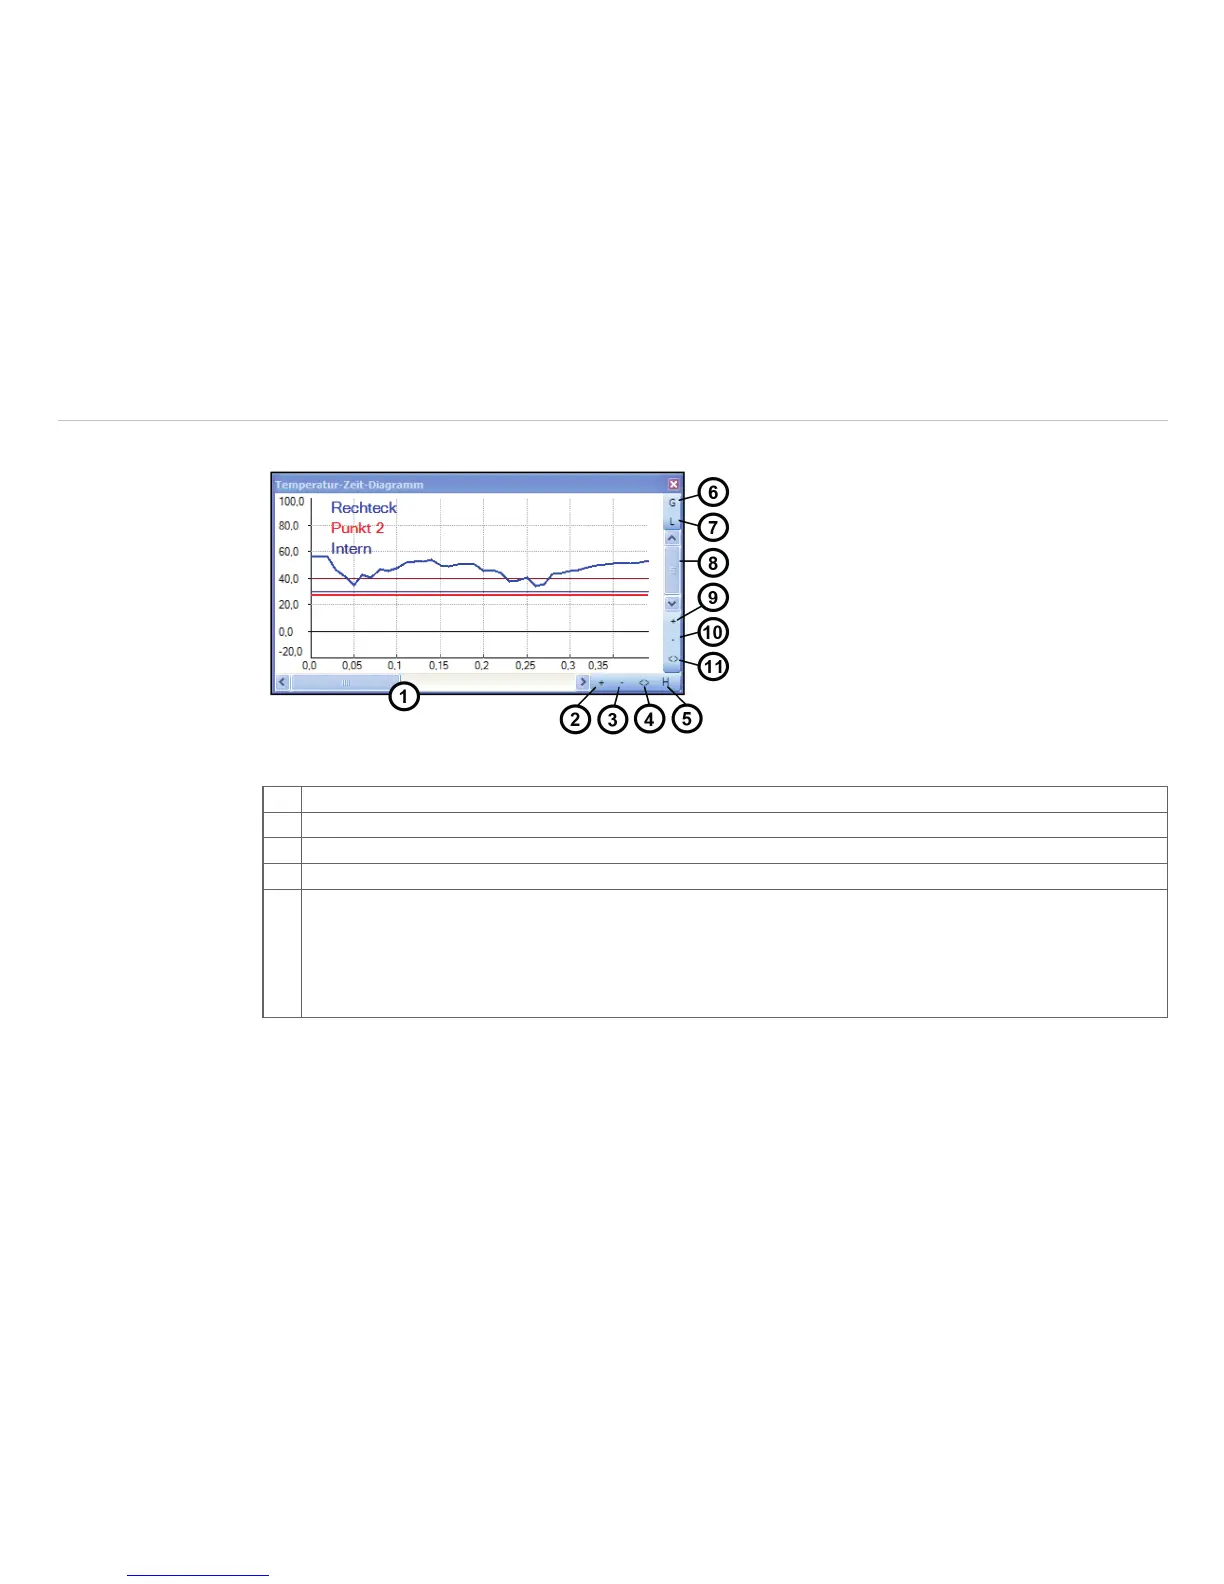
Control elements of the time axis
1 Scroll bar to choose time segment
2 Zoom (increase) into the diagram. The temperature axis will remain.
3 Zoom (decrease) into the diagram. The temperature axis will remain.
4 Whole range: Display of whole time axis, e.g. of a stored video sequence.
5 H: Hold/ C: Continue: Any activation of the H control element will stop the further actualization of the
measurement graph. The measurement itself continues in the background. To return to the current
measurement graph please press the C control element.
During the stopped status any parts of the diagram can be selected. With the zoom in-button + these
parts can be stretched (enlarged) and with the zoom out-button – clinched (minimized).