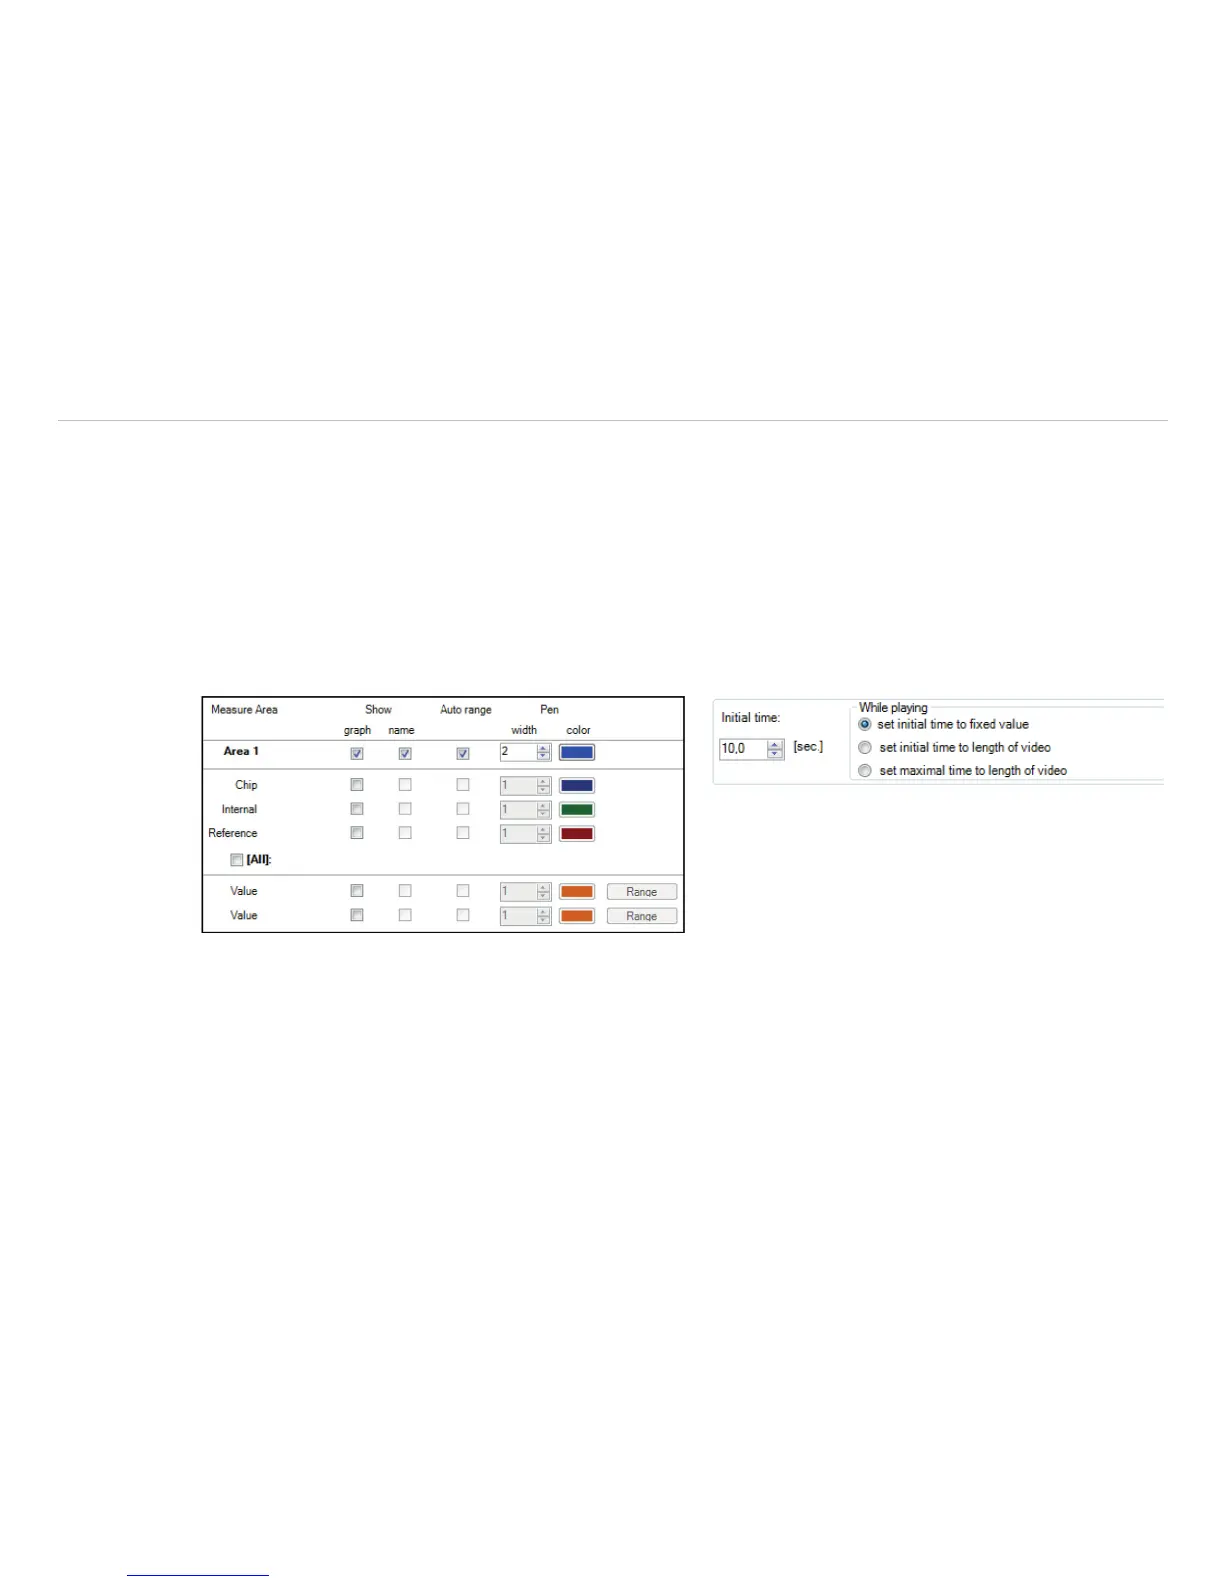
6.3 Temperature Time Diagram
6.3.1 General Settings
In the Tools, Configuration and Temp/Time Diagram menu you can display the temperature over time for
each configured measure area as well as for predefined values, see Chap. 4.2.4.
The Show options define if a certain temperature value is displayed or not. If the graph is shown you can decide
whether to illustrate the name or not.
If activating the option Auto range the respective graph is influencing the auto ranging of the diagram.
If the option is not chosen the scaling is based on the other temperature values.
In the menu Pen, the width of the graph as well as its color can be individually configured.
Fig. 79 View temperature measure area Fig. 80 View initial time
A further option is to define the time scaling of the diagram at a minimum[sec.]. If activating set initial time
to fixed value the time scale will be the length of the initial time chosen. When choosing set initial time
to length of video the time scaling is adjusted to the length of the stored video sequence loaded into the soft-
ware. With set maximal time to length of video the scaling of the time axis is fixed to the whole recording
length.