6.2 Temperature Profile
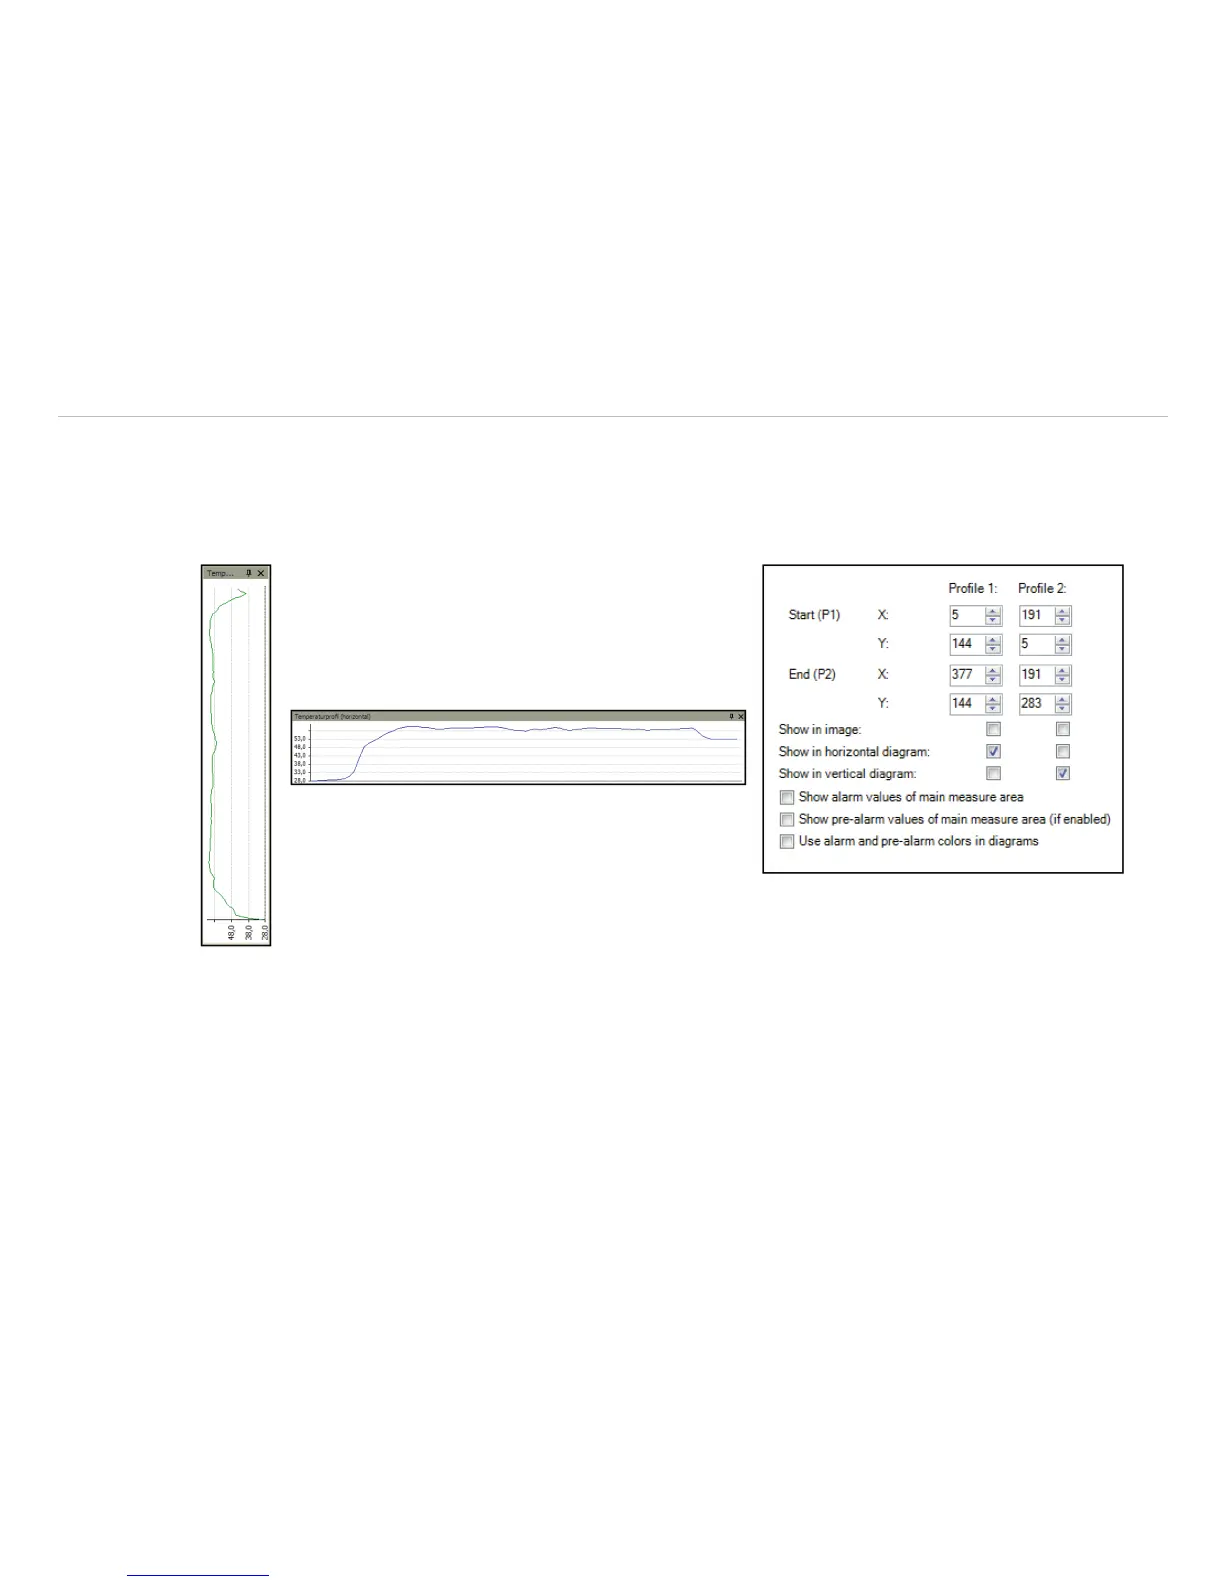
Up to 2 temperature profiles which graphically reproduce the temperature development can be generated. Therefore
go to Tools, Configuration and Temp. profiles. The profiles are labeled as Profile 1 and Profile 2.
The position and size of the profiles can be defined via the coordinates Start (P1) and End (P2).
Select Show in image if you want the profiles to be
displayed in the infrared image in the main window.
Alternatively, this setting can be made by choosing the
menu View and Image information, see Chap.
4.2.3.
Fig. 75 Views Temperature profiles
The position and size of the profiles can be also defined by dragging the grippers at the end of the lines within the
image of the main window. The temperature profiles can be displayed in additional windows, see Chap. 4.2.1. Using
the options Show in horizontal diagram, Show in vertical diagram, Show alarm values of main
measure area, Show pre-alarm values of main measure area and Use alarm and pre-alarm col-
ors in diagrams the profiles can be assigned to the horizontal and / or vertical diagram window.
The option Range allows you to choose between automatic or manual adjustment of the temperature scaling within
the diagram. There are two possibilities of displaying the profile Curve in the profile diagram. Using the option As-
sign to image the profile curve fills only the parts corresponding with the actual length of the profile in the image.