6.4 Histogram
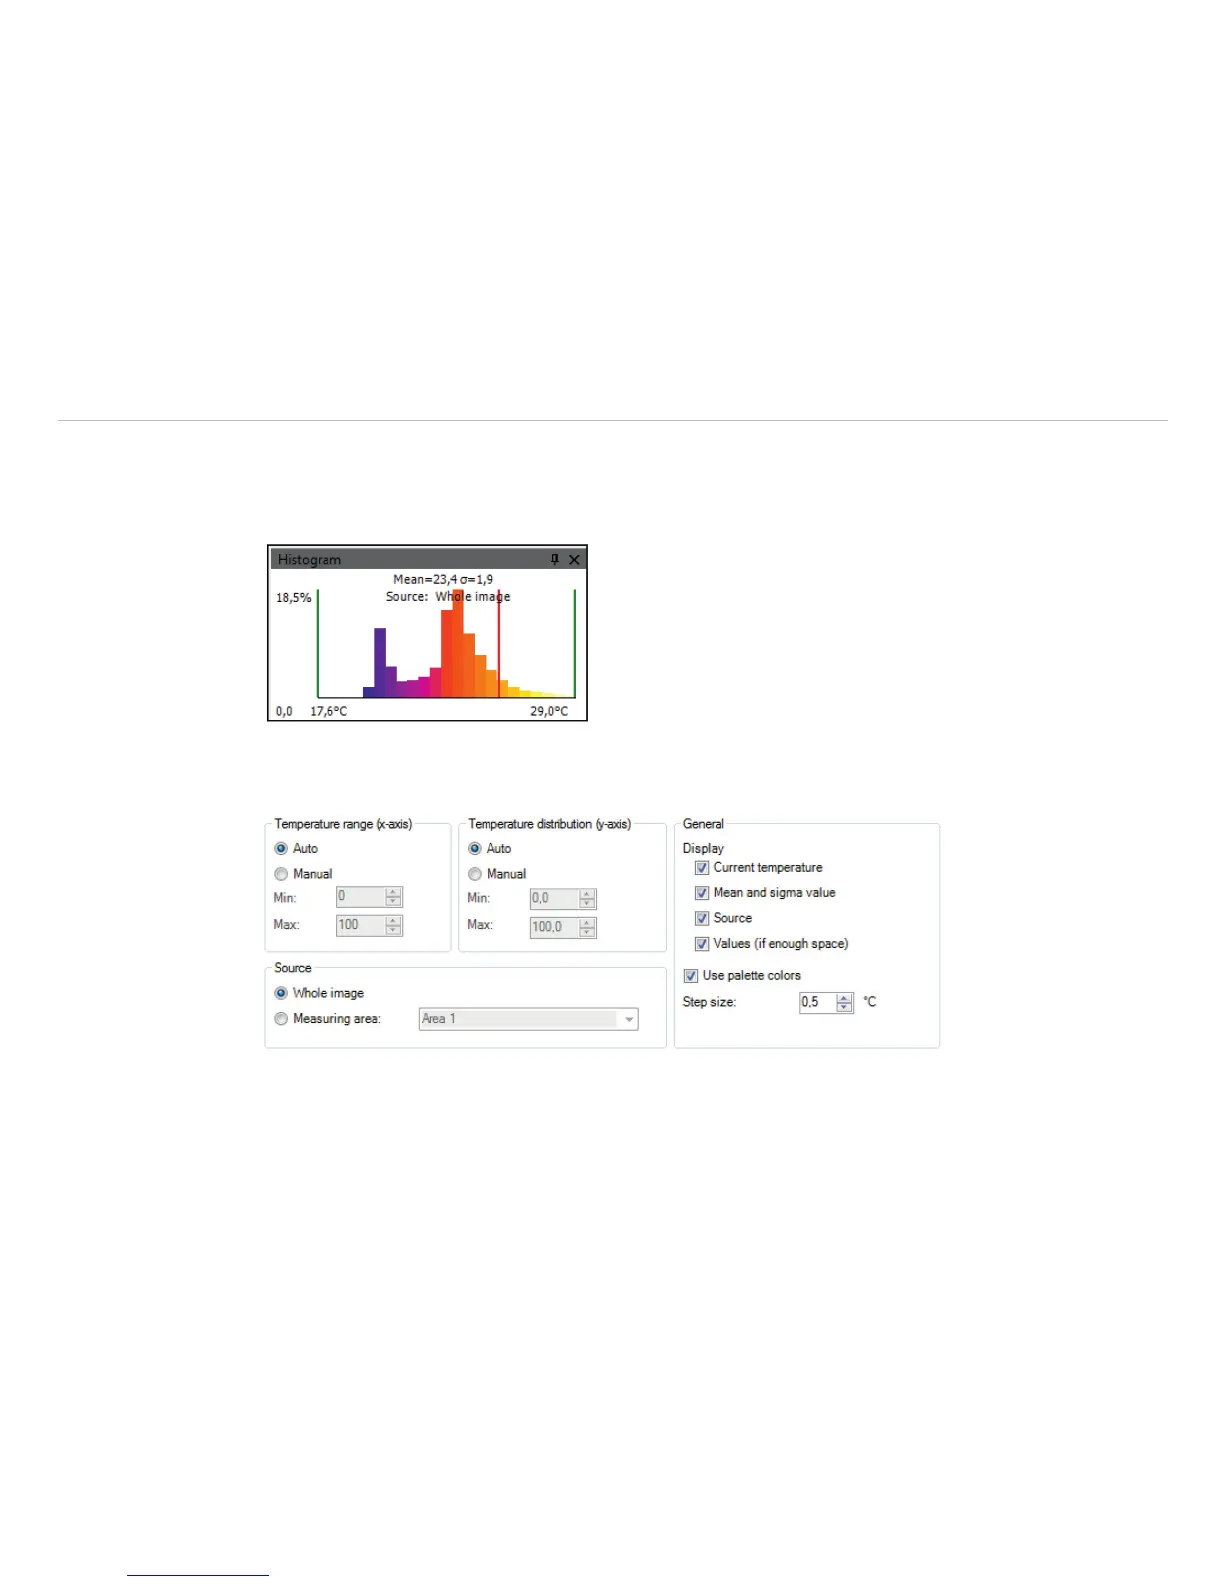
The Histogram feature shows the distribution of pixel intensity values within a thermal image. The X-axis of
the histogram represents the pixel intensity and the Y-axis represents the percent of color count for each pixel
intensity value.
In the Tools, Configuration and Histogram menu you can adjust various settings. The given Tempera-
ture range and Temperature distribution can be generated by the software or by the user by defin-
ing the minimum/maximum temperature range respectively minimum/maximum temperature distribution.
Fig. 82 View temperature range, Temperature distribution, General
 Loading...