X-Series Hyperconverged Nodes Powered by Acuity
Setup & User Guide, v1.0
39
|
DOC-246-GDE-Pivot3 Acuity 2.3 Setup & User Guide-v1.0.docx
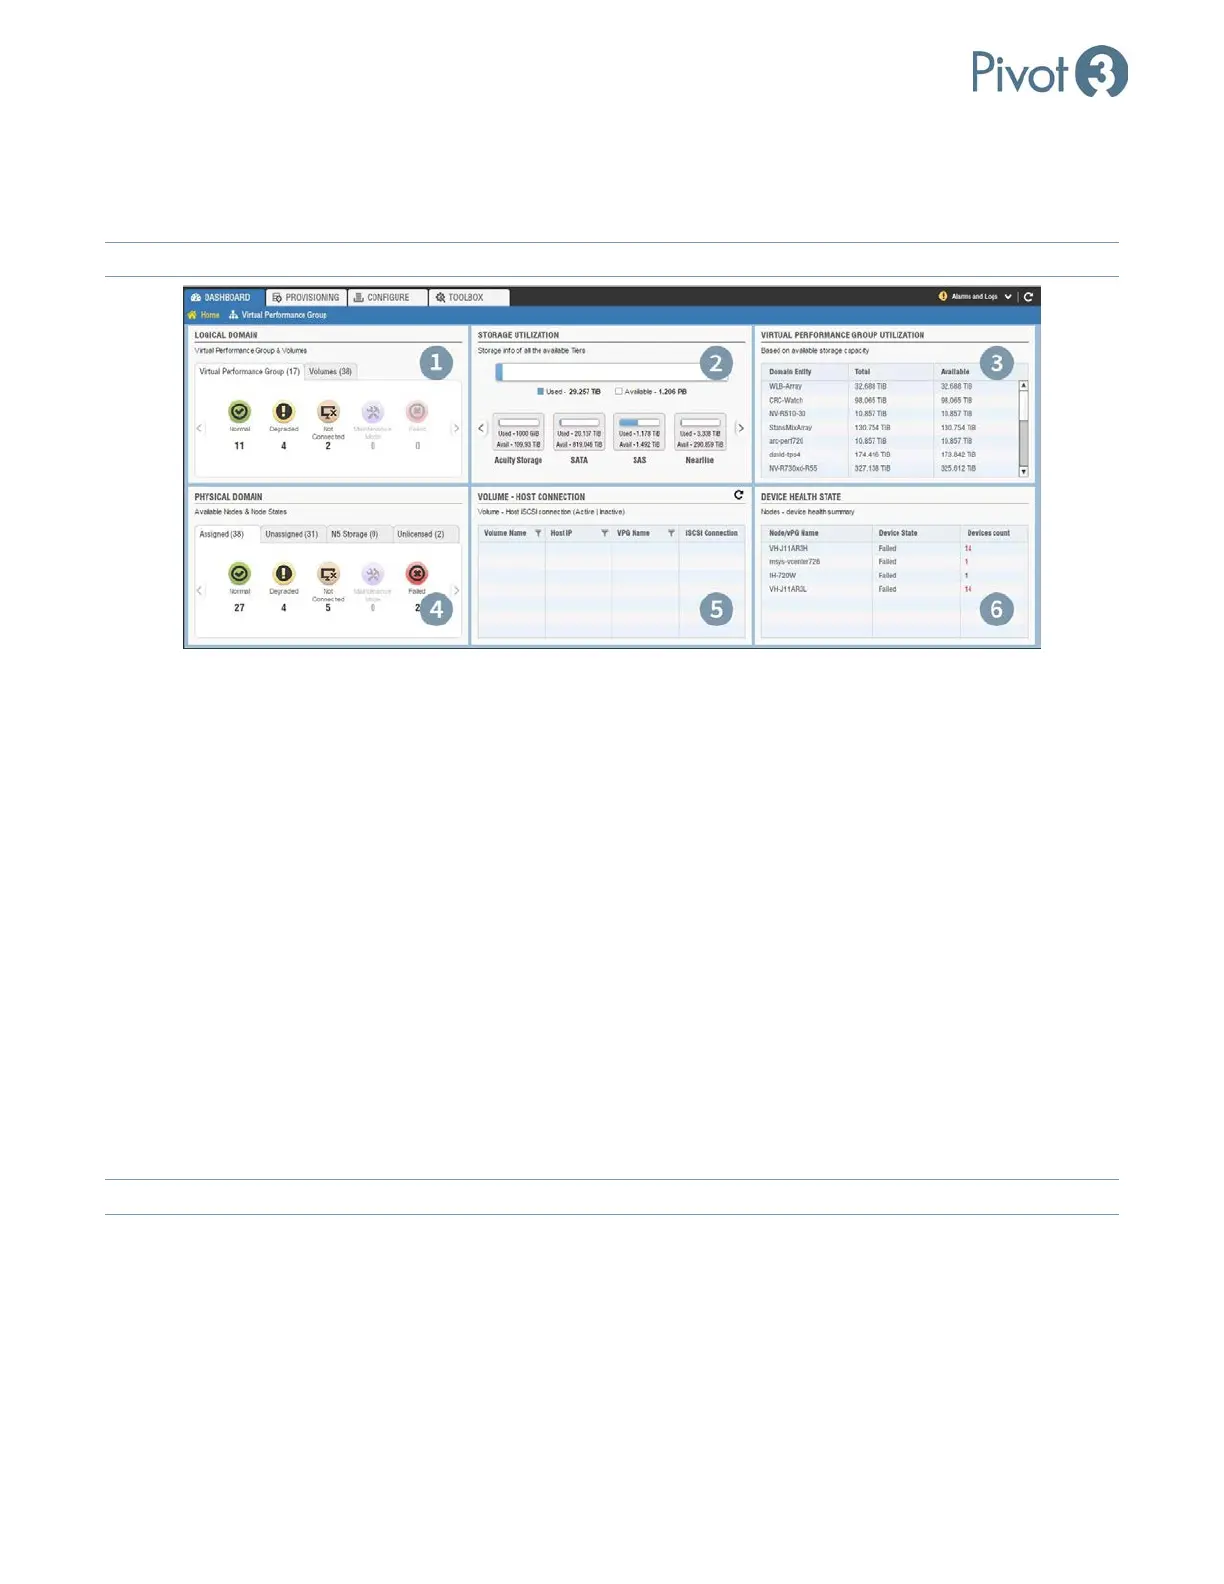
The Home view includes total storage details such as types of drives used (e.g., SATA, SSD) and available capacity,
all Acuity vPG utilization based on available storage, node States, active and inactive iSCSI Host connections, all
logical volumes within the domain, and summary of critical devices within the nodes.
NOTE: Linux-based Dashboards will not populate with nodes & vPGs until Discover Nodes
has been performed.
1. Logical Domain Health Summary
The Logical Domain component shows a summary of the health states for all discovered vPGs in the domain and
Volumes in separate tabs.
2. Storage Utilization
The Storage Utilization component shows a summary of all used and available storage in the domain.
3. Virtual Performance Group Utilization
The Virtual Performance Group Utilization component shows a list of vPGs along with their total and available
capacities. This data can be sorted in ascending or descending order by clicking on the desired column header.
4. Physical Domain Health Summary
The Physical Domain component shows a health summary of all nodes. The node can be in any status among
Normal, Degraded, Not Connected, Maintenance Mode, or Failed. This section breaks down into four
categories: Assigned, Unassigned, N5 Storage, and Unlicensed.
NOTE:
The Unlicensed view will only show up if an unlicensed vSTAC node has been discovered in the domain.