Setup & User Guide
53 |
DOC-246-GDE-Pivot3 Acuity 2.3 Setup & User Guide-v1.0.docx
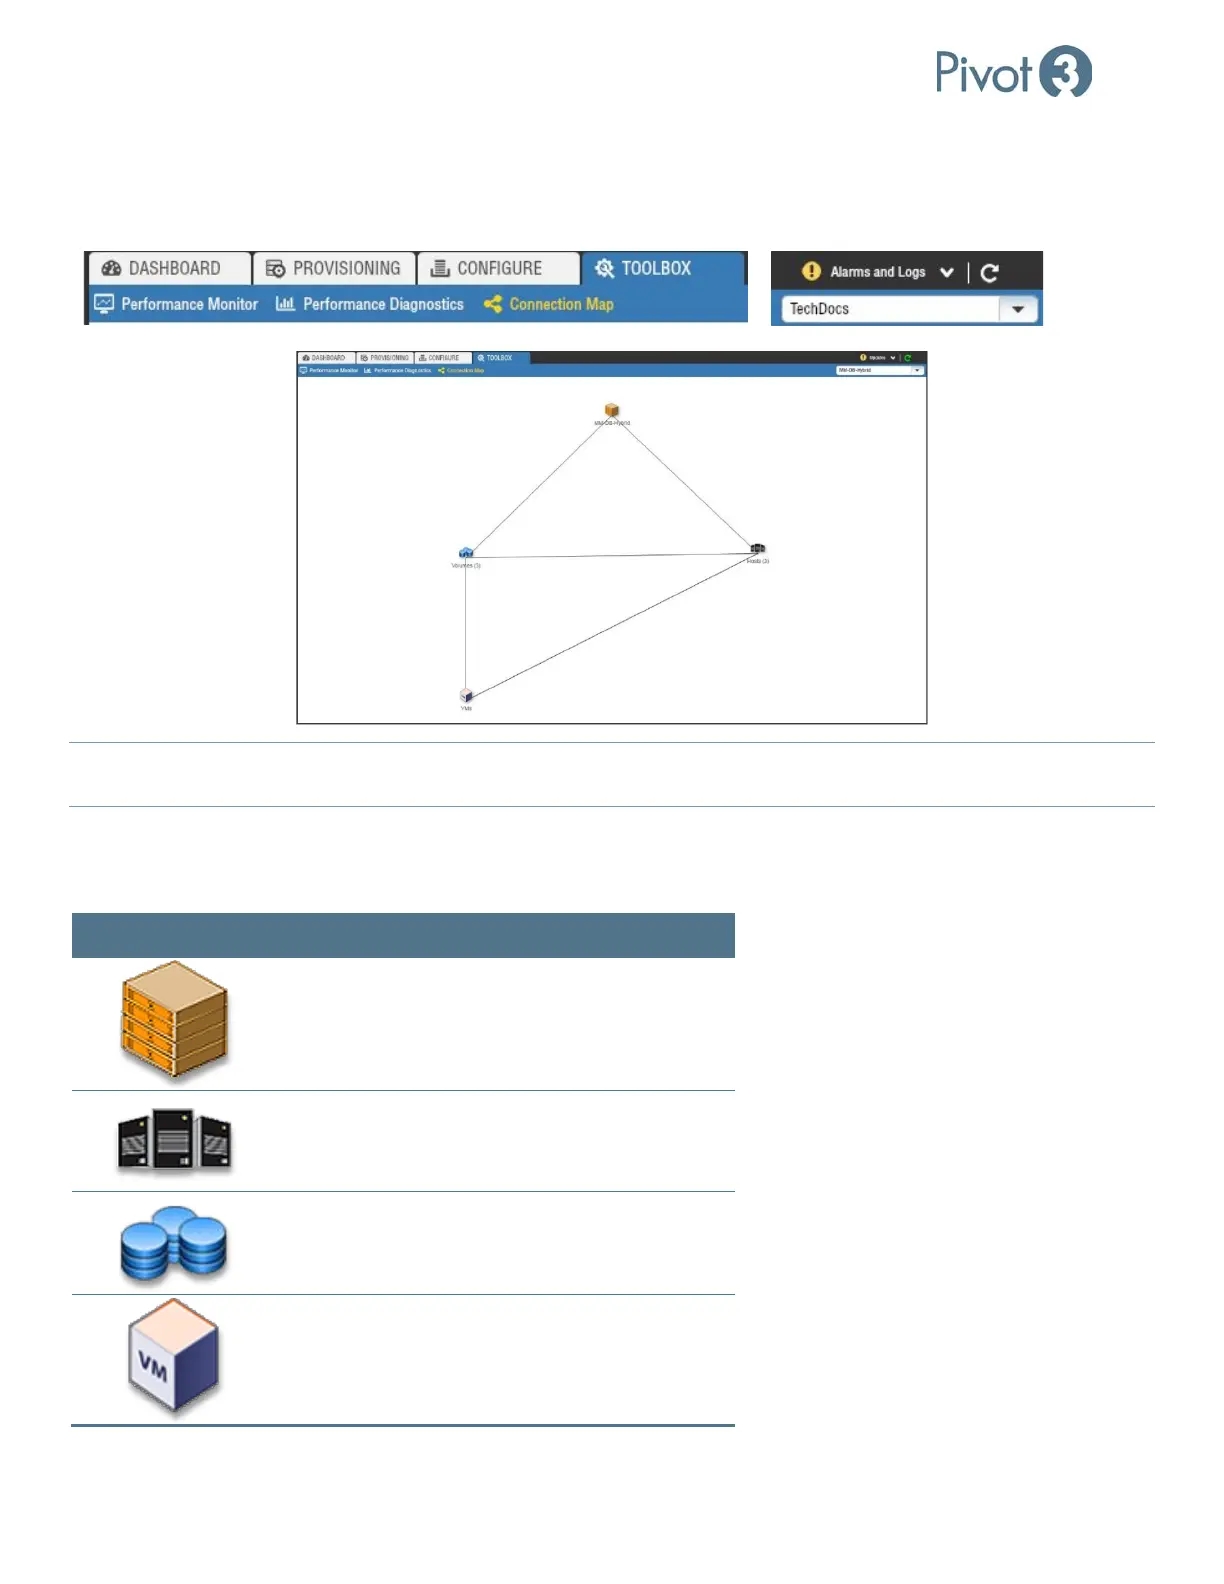
Connection Map
The Connection Map provides an interactive, high-level mapping diagram of the local environment. Click on the
Connection Map view of the Toolbox tab, then choose the desired vPG from the drop-down box in the top right corner.
NOTE:
The entities shown here may be moved around to improve visibility or double-clicked to drill down further into the
domain structure. Hover over each icon for more information.
After selecting a vPG, the screen will display a summary diagram that allows the user to drill down for additional details on
several aspects of the vPG. At this highest level, the map has icons that represent the nodes in the vPG, the volumes in the
vPG, the ESXi hosts associated with the vPG, and the VMs hosted by these ESXi hosts.
Icon Double-Click for Details On
vPG
Host
Volume
VMs