Setup & User Guide
| 54
DOC-246-GDE-Pivot3 Acuity 2.3 Setup & User Guide-v1.0.docx
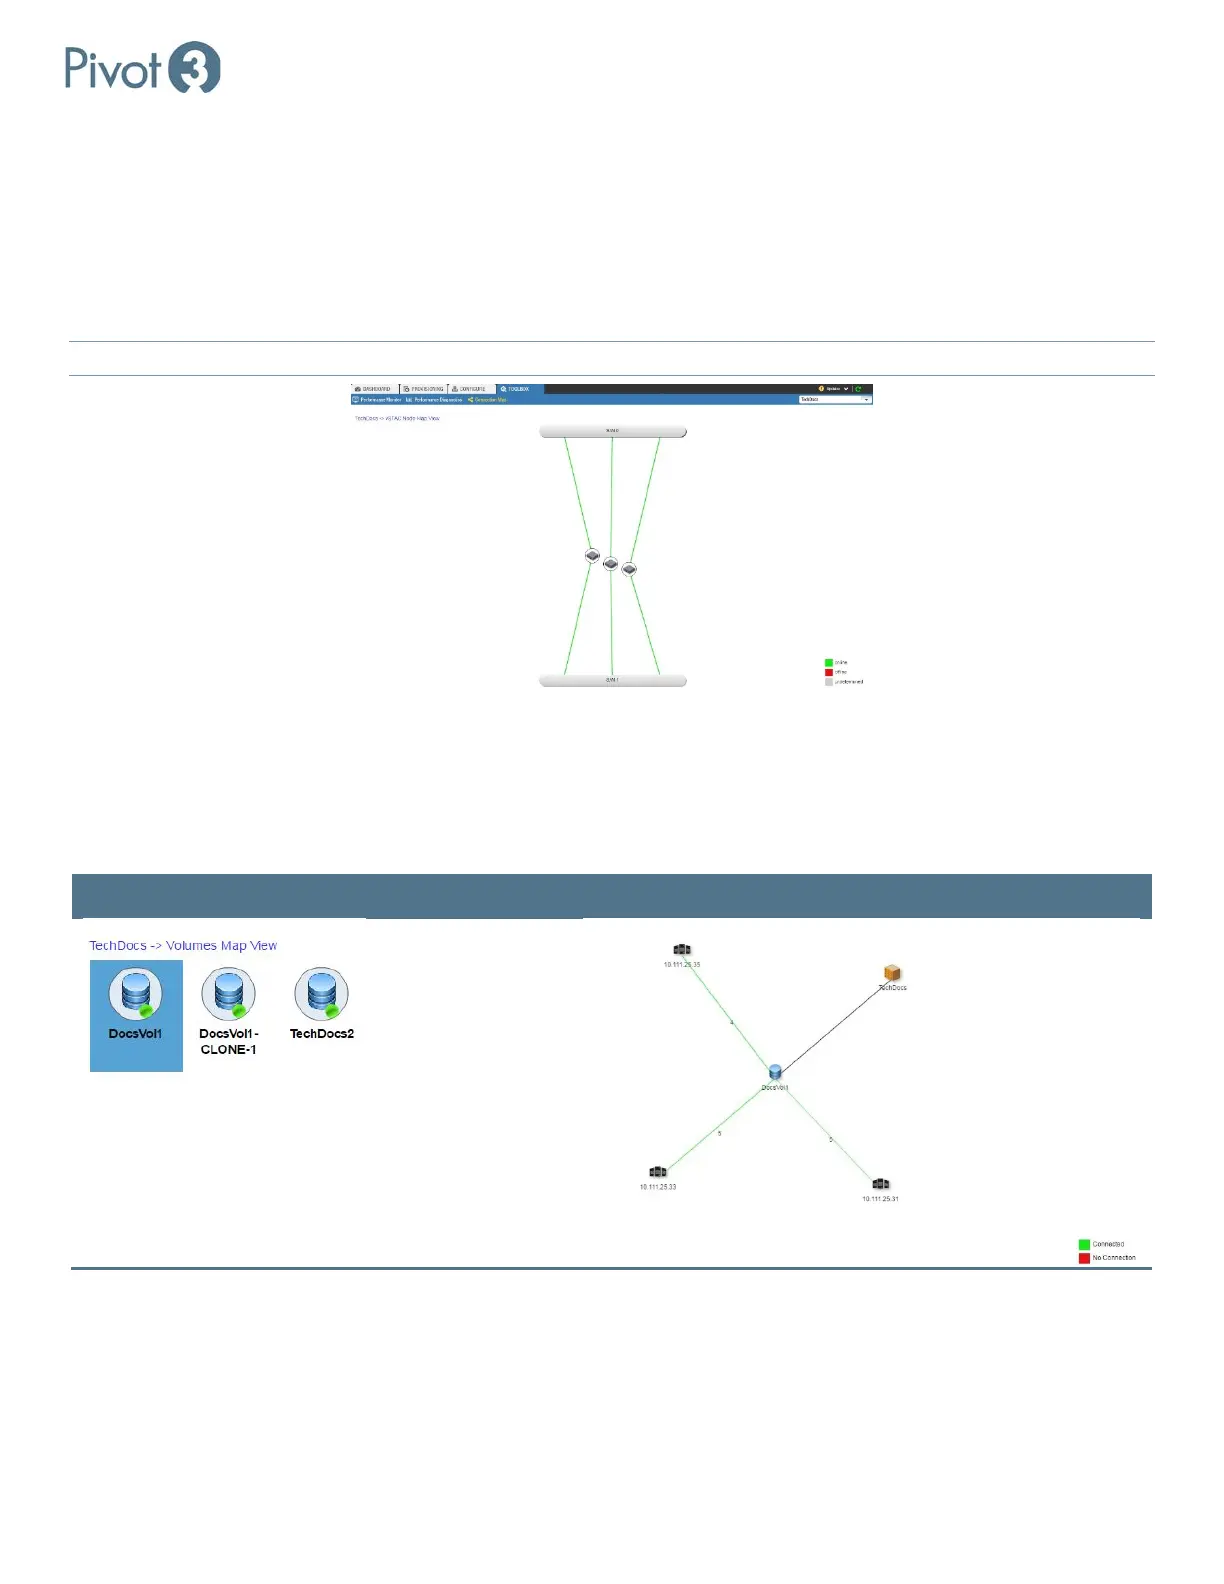
Connection Map – Node Map View
Double-clicking on the vPG icon will provide the Node Map View with color-coded connectivity displayed. This view
shows the nodes that make up the selected vPG.
Hovering over one of the node icons will provide a popup with additional details about the node (e.g., node name, model,
current physical state); hovering over the colored line will display data round trip times. Lines will not be colored for vPGs
running a vSTAC OS version lower than 7.3.0.
NOTE: Double-clicking on any of the nodes displayed will navigate to the Configure
tab view for that node.
To return to the vPG view, click on the leftmost entity in the top left of the window.
Connection Map – Volume Details
Double-clicking on the Volumes icon will navigate to a Volumes Map View. In this view, each volume may be double-
clicked to navigate to the Volume Details Map view for that specific volume.
Volumes Available Volume Details Map View
The combination of the icons here represents, for the selected volume:
• Hosts connected to the volume
• Number of connections from each host to the volume
To return to the vPG view, click on the leftmost entity in the top left of the window.