Observing and Recording Leaf Gas Exchange
CIRAS-2 Operator's Manual Version 2.04
- 64 -
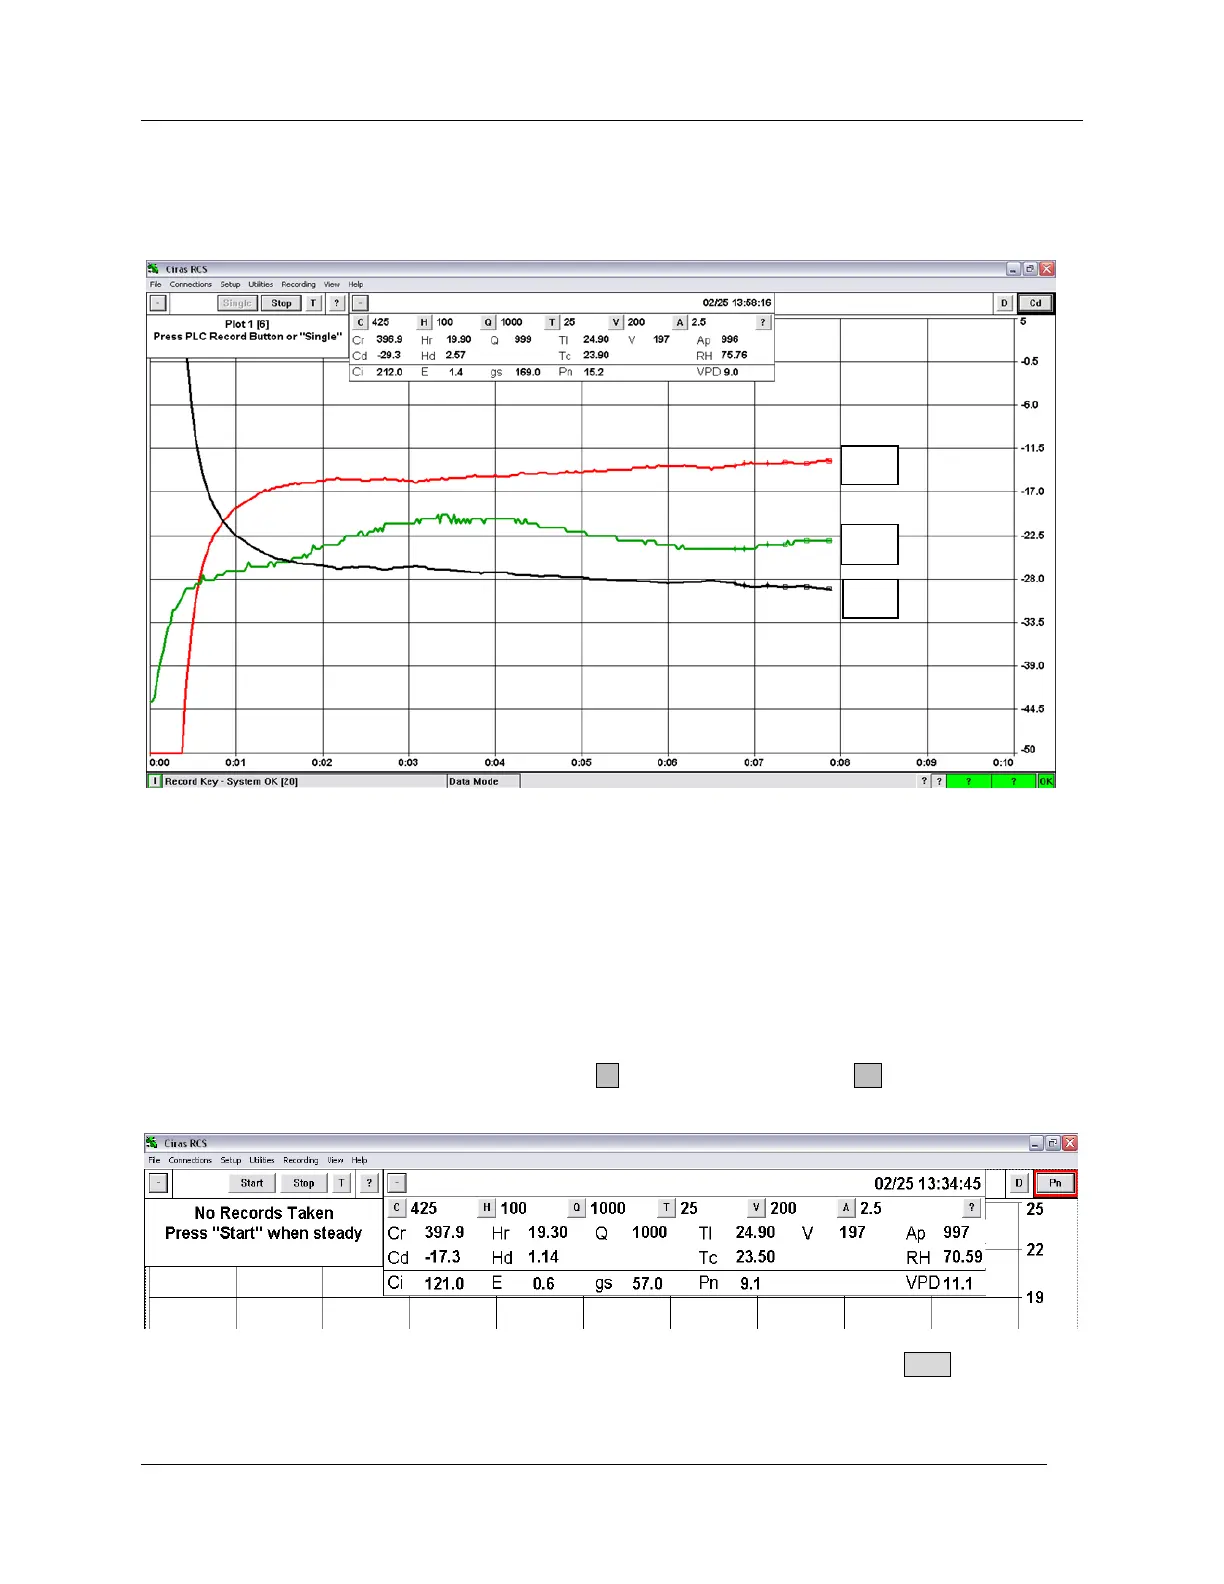
humidity (Hd) becomes positive – the leaf is both fixing carbon dioxide and transpiring water vapor. As
seen in the figure below, Pn (red plot) and Cd (black plot) typically appear as near mirror images. The
green plot is the leaf temperature.
Note that some physiological variables, especially Pn, gs (stomatal conductance) and Cd will continue
changing as the leaf equilibrates (approaches a stable state) for approximately 45-60 seconds, and as
long as a few minutes. This depends largely on the preconditioned state of the plant relative to the
environmental conditions inside the cuvette. A useful illustration of this can be seen with a highly shade-
adapted plant that is suddenly exposed to strong light intensities in the leaf chamber. In this case, delayed
gas exchange responses can be expected compared to a plant (or leaf) accustomed to more intense light
conditions.
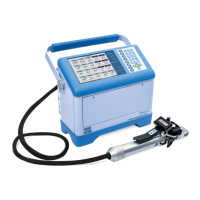
In Recording Mode the CIRAS-2 display changes (upper section of display screen shown, below),
including a new window (upper left) containing Recording features as well as the now familiar Data
Display and Control features window. Click the - button to collapse or the + button to view either
window. You may need to adjust to a smaller font size to accommodate both windows.
When readings are stable and you are ready to begin measurements, click the Start button in the
Recording window. Depending on the state of your CIRAS-2, the instrument may perform a Zero and Diff
Bal. You may also take this opportunity to adjust your Graphing Options, for example, by selecting one or