Observing and Recording Leaf Gas Exchange
CIRAS-2 Operator's Manual Version 2.04
- 69 -
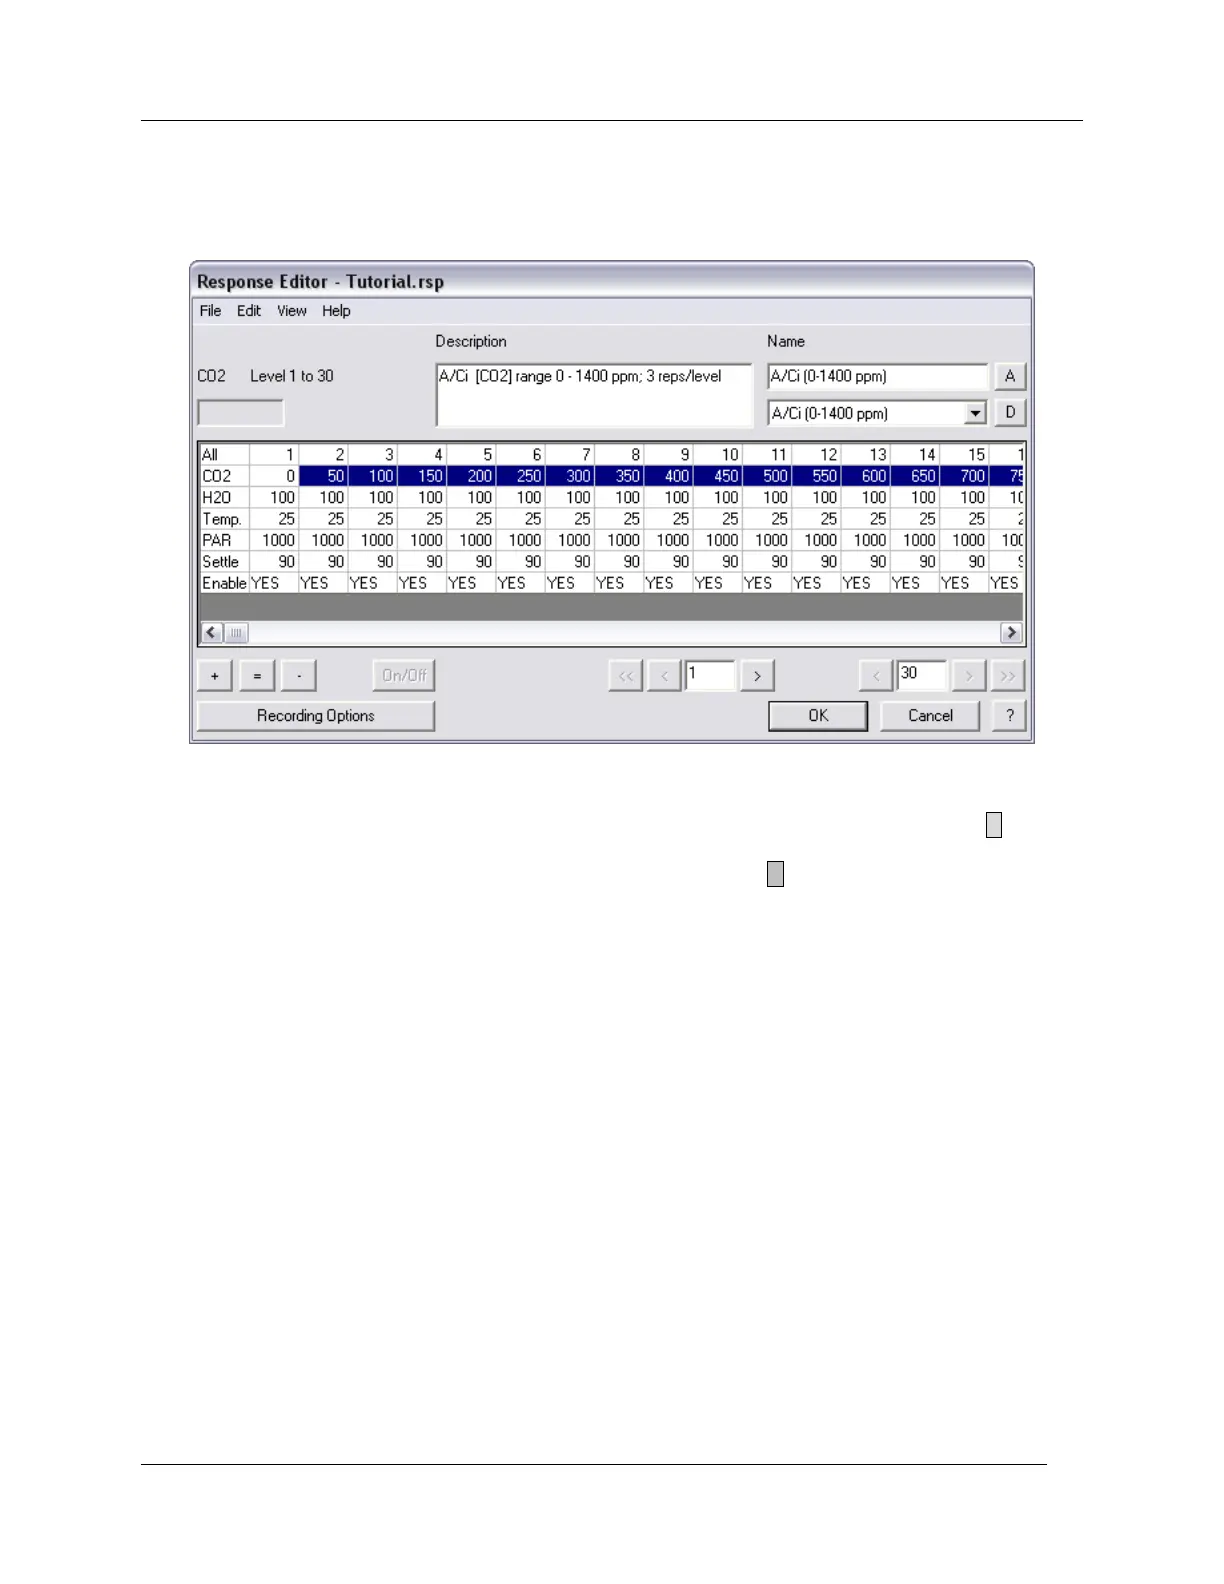
Select Response Curve to bring up the Response Editor window. Retrieve a previously saved
Response file (.rsp) by clicking File – Open in the Response Editor dialog. To create a new response
curve, enter the desired settings in the Response Editor dialog as shown below:
In the „Name‟ field to the right you may enter a name for your response curve by clicking on Default Rsp
Name 1‟ and typing a new name (optional). You may also enter an optional description. Click A to add a
named Response setup. It is best to save the response file early, and then make alterations to the saved
file. In the Response Editor dialog click File – Save As. Click D to delete the currently selected
response. Each Response File (.rsp extension) can contain up to 10 Response Curves. The options for
each are saved with the Response Curve Definition.
Editing Response Variable Values
Editing All the Values in a Row
In the first column at left are headings for the response curve variables. „All‟ refers to the 30 available
Response Levels in a response curve. Levels 1 through 15 are visible in the Response Editor. If the first
cell marked All is selected, it is possible to reset all the values to the default.
Clicking on the variable heading in the first column will highlight that variable in blue (as CO2, above), and
will bring up the Enter _ Value dialog box. After entering a „Start Value‟, you may increase (Increment),
hold constant (Set Equal), or decrease (Decrement) the „Start Value‟ through your selected range of
Levels. The example above shows a constructed response curve that dynamically increases CO
2
only,
experimentally subjecting the leaf to 50 ppm incremental changes