Graphing Preferences
CIRAS-2 Operator's Manual Version 2.04
- 57 -
Graphing Preferences
Before continuing you can select the variables you wish to view in the real-time display. You can access
this dialog in one of four ways:
1. Click Setup in the CIRAS main menu and open the Graphing – Preferences dialog box
2. Through the Graphing Options button in the Setup dialog
3. Right-click anywhere on the Time or Data Plots using RCS from a computer
4. Click anywhere on the Time or Data Plots with the mousepad and pointer using the UI.
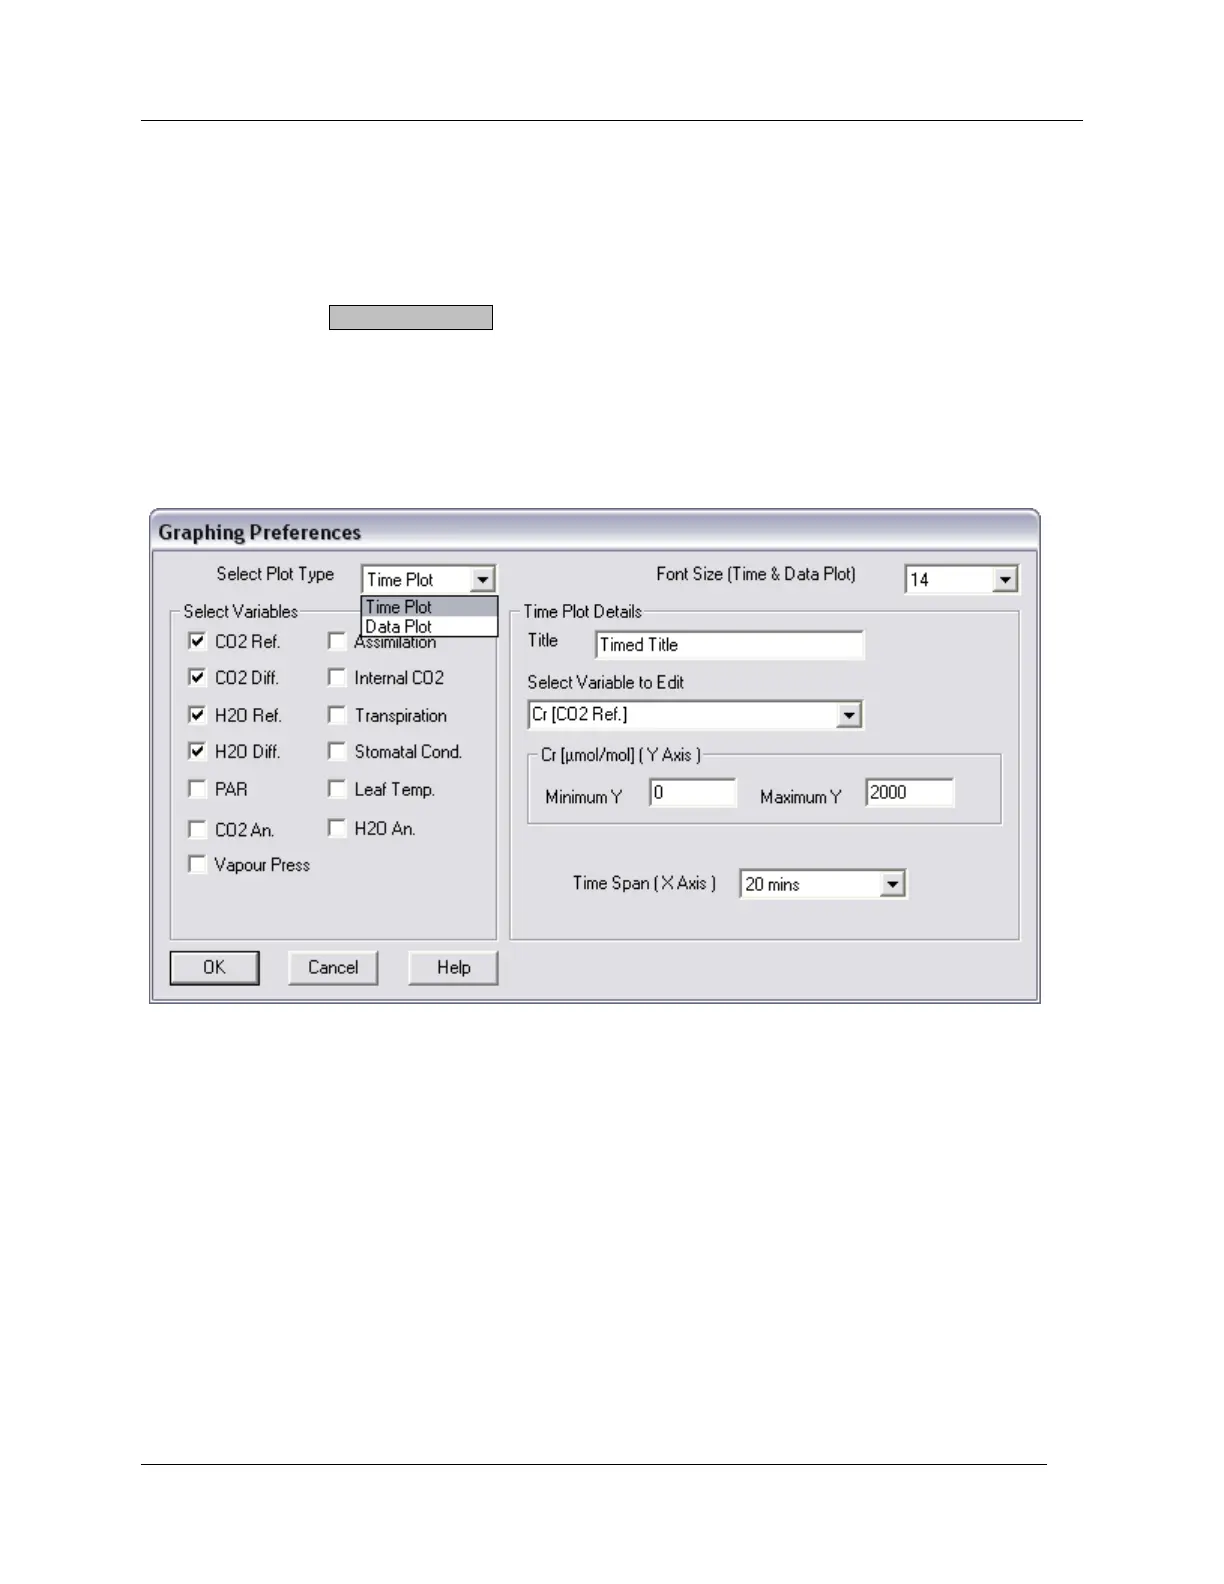
Time Plot
From the „Select Plot Type‟ list choose Time Plot.
Select Variables
Choose up to four variables to display as continuous colored plots in the Time Plot. At least one variable
must be displayed. The list of variables automatically changes based on Accessories, e.g. variables
related to chlorophyll fluorescence while using the CFM module.
The available list is drawn from the parameters and variables seen in the Gas Exchange Measurement
Screen section (page 26), with two exceptions – CO2 An. (Analysis gas CO
2
) and H2O An. (Analysis gas
H
2
O). CO2 An. is simply CO2 Ref. + CO2 Diff. Likewise, H2O An. is the H2O Ref. + the H2O Diff.
Font Size
Choose the font size that best meets your needs – larger fonts for computer RCS display, smaller for the
UI when conducting research in the field.