Brief Introduction to Chlorophyll Fluorescence
CIRAS-2 Operator's Manual Version 2.04
- 122 -
very small (<0.05 µmol m
-2
s
-1
), too small to induce significant physiological change in the sample
(Schreiber et al. 1986), yet powerful enough to provide a reliable signal for fluorescence analysis.
The interpretation of fluorescence signals has developed considerably since the early experiments of
Kautsky and Hirsch (1931) with several techniques employed to determine information about the
photosynthetic performance of PSII (Baker 1991). The CFM-1 hardware and software has been designed
to incorporate these techniques into simple routines which store appropriate fluorescence measurements
and automatically calculate key parameters.
Common Fluorescence Measurements
There are a vast number of different measurement protocols and parameter nomenclatures. This section
will cover the instrumentation requirements of the two most common fluorescence analysis procedures.
The most widely accepted parameter definitions used by “main-stream” workers are presented in a
glossary with alternative nomenclatures.
There are two common types of fluorescence measurement:
1. Fluorescence Induction Analysis (Kautsky Curve).
If a sample is dark adapted the PSII electron acceptor pool is gradually re-oxidised to a
point where all of the PSII reaction centres are capable of under-taking photochemistry.
Illumination induces a fast (approx. 1 s) polyphasic rise in fluorescence which is
followed by a slow (approx. 2 min) fluorescence decline to a steady state level of
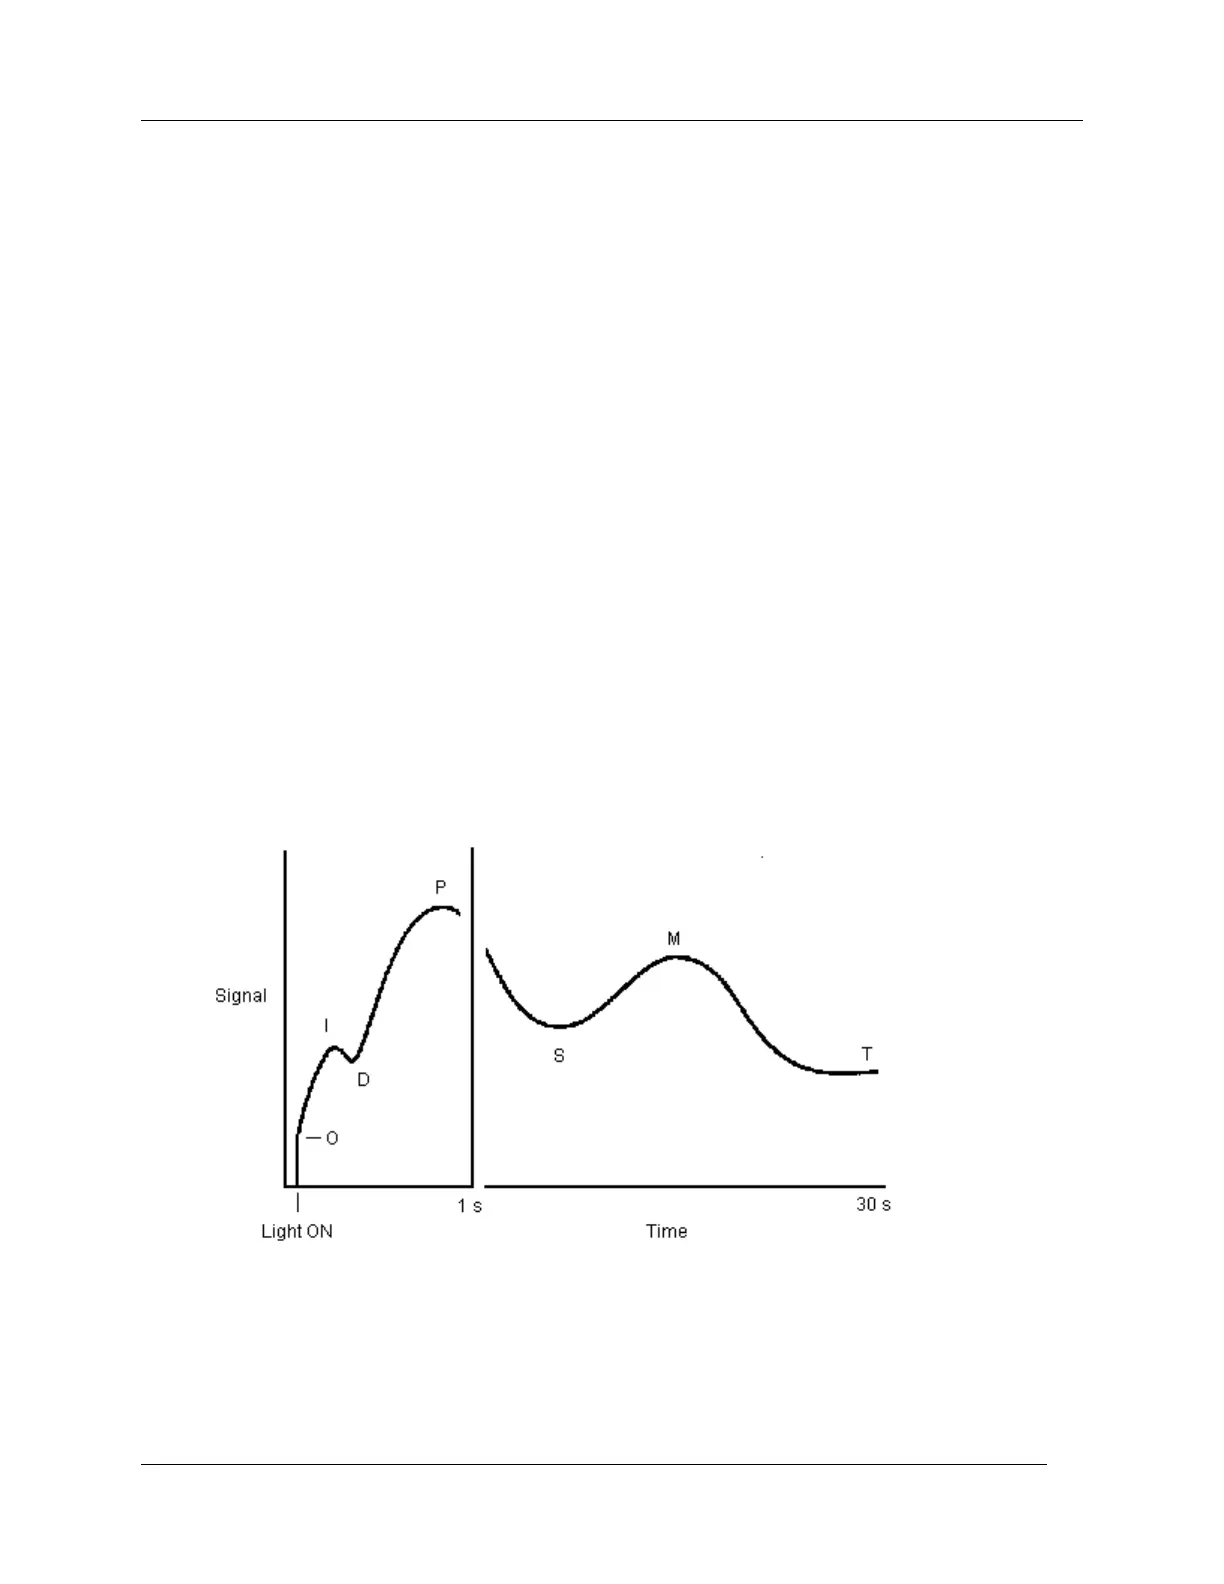
fluorescence. This induction phenomena is often referred to as the Kautsky Curve.
The different phases of the Kautsky Curve relate to different limiting reactions which
occur as photosynthetic reactions are initiated; originally they were denoted with the
letters O,I,D,P,S,M,T. With the development of shutter-less high-speed data sampling
instruments such as the Hansatech Plant Efficiency Analyser a further (J) peak was
discovered in the fast fluorescence rise. This is best observed on a logarithmic plot.