Graphing Preferences
CIRAS-2 Operator's Manual Version 2.04
- 58 -
Time Plot Details
Enter a description of the plot(s) if desired. This information will be saved with the data file.
Select Variable to Edit
The respective Y-axis scales of your chosen variables can be changed from defaults by choosing the
variable from the dropdown list. You will see a message if you set the scale outside of the min-max range.
Time Span
Choose your desired X-axis time span (10, 20 or 30 minutes).
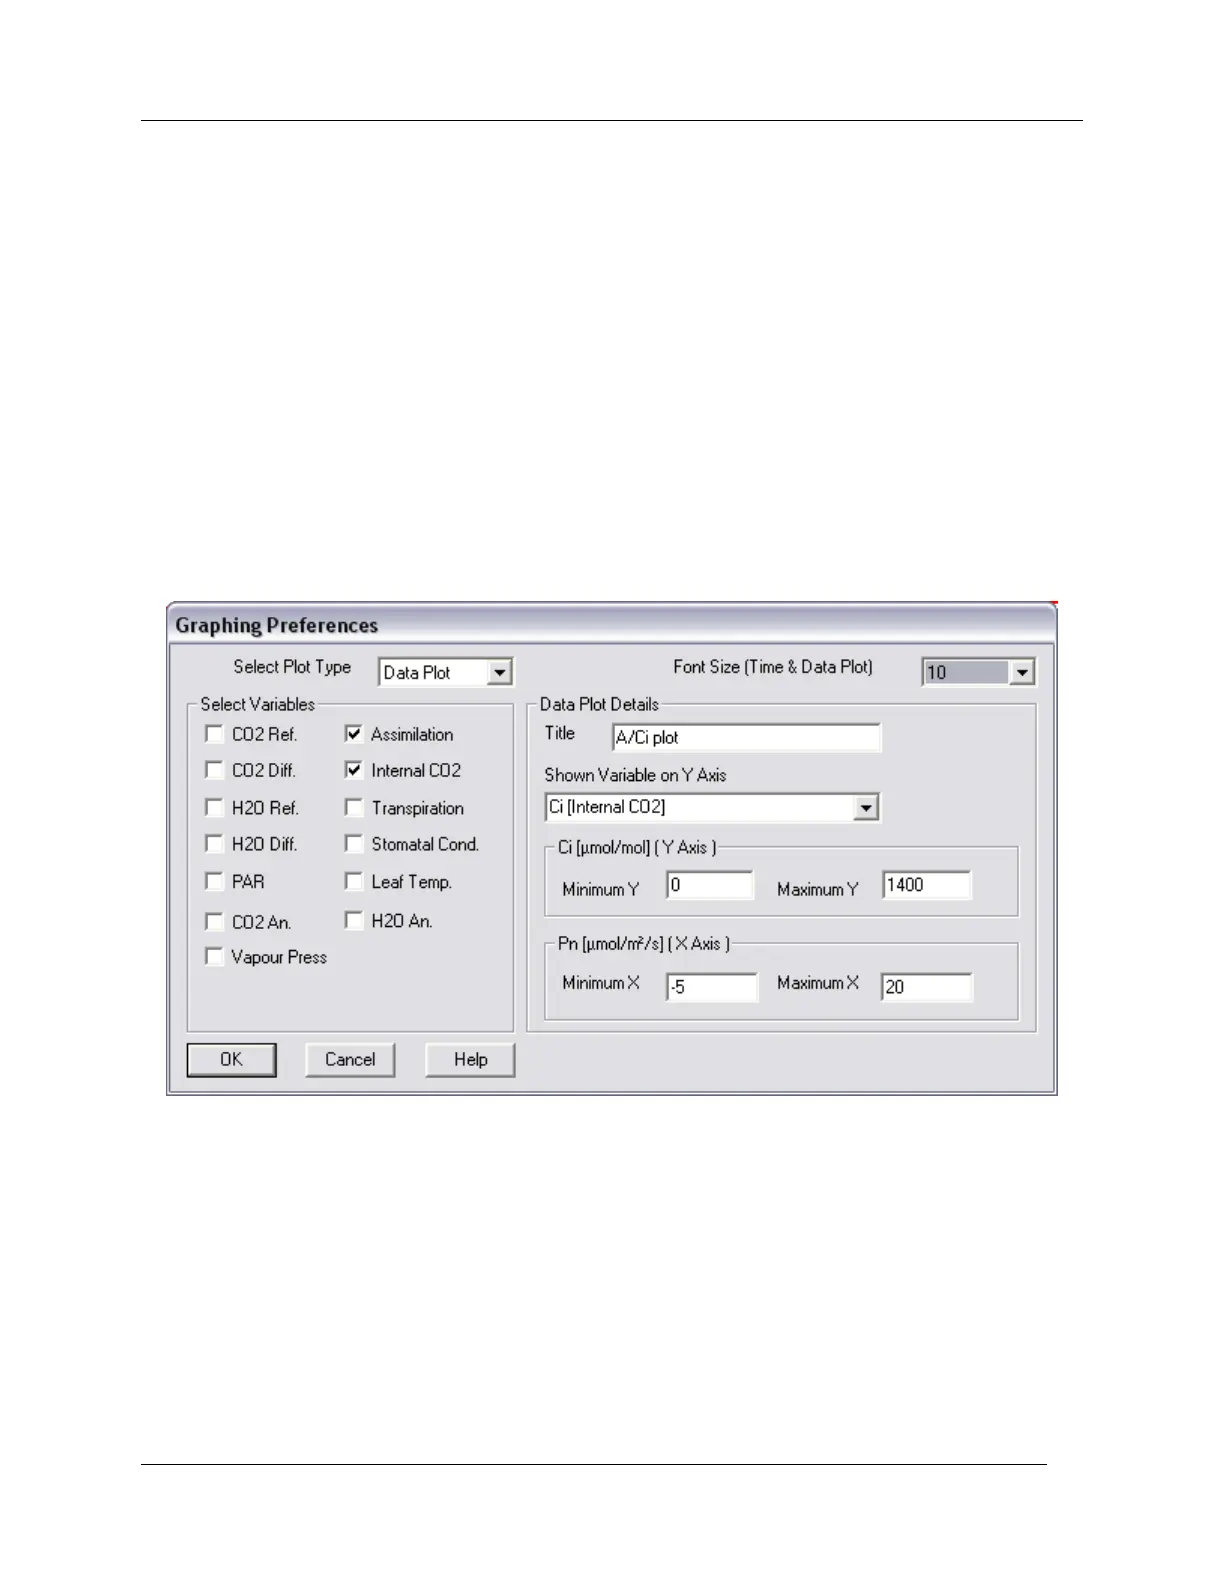
Data Plot
From the „Select Plot Type‟ drop down list select Data Plot. This plot displays two variables only, plotting
data against data. Essentially, it allows you to view a real-time scatter plot, for example, an A/Ci plot.
Shown Variable on Y Axis
Choose which of the two variables to display as the response (Y-axis) variable, then set the min-max
scales for both selected variables as above.