CFM Operation
CIRAS-2 Operator's Manual Version 2.04
- 107 -
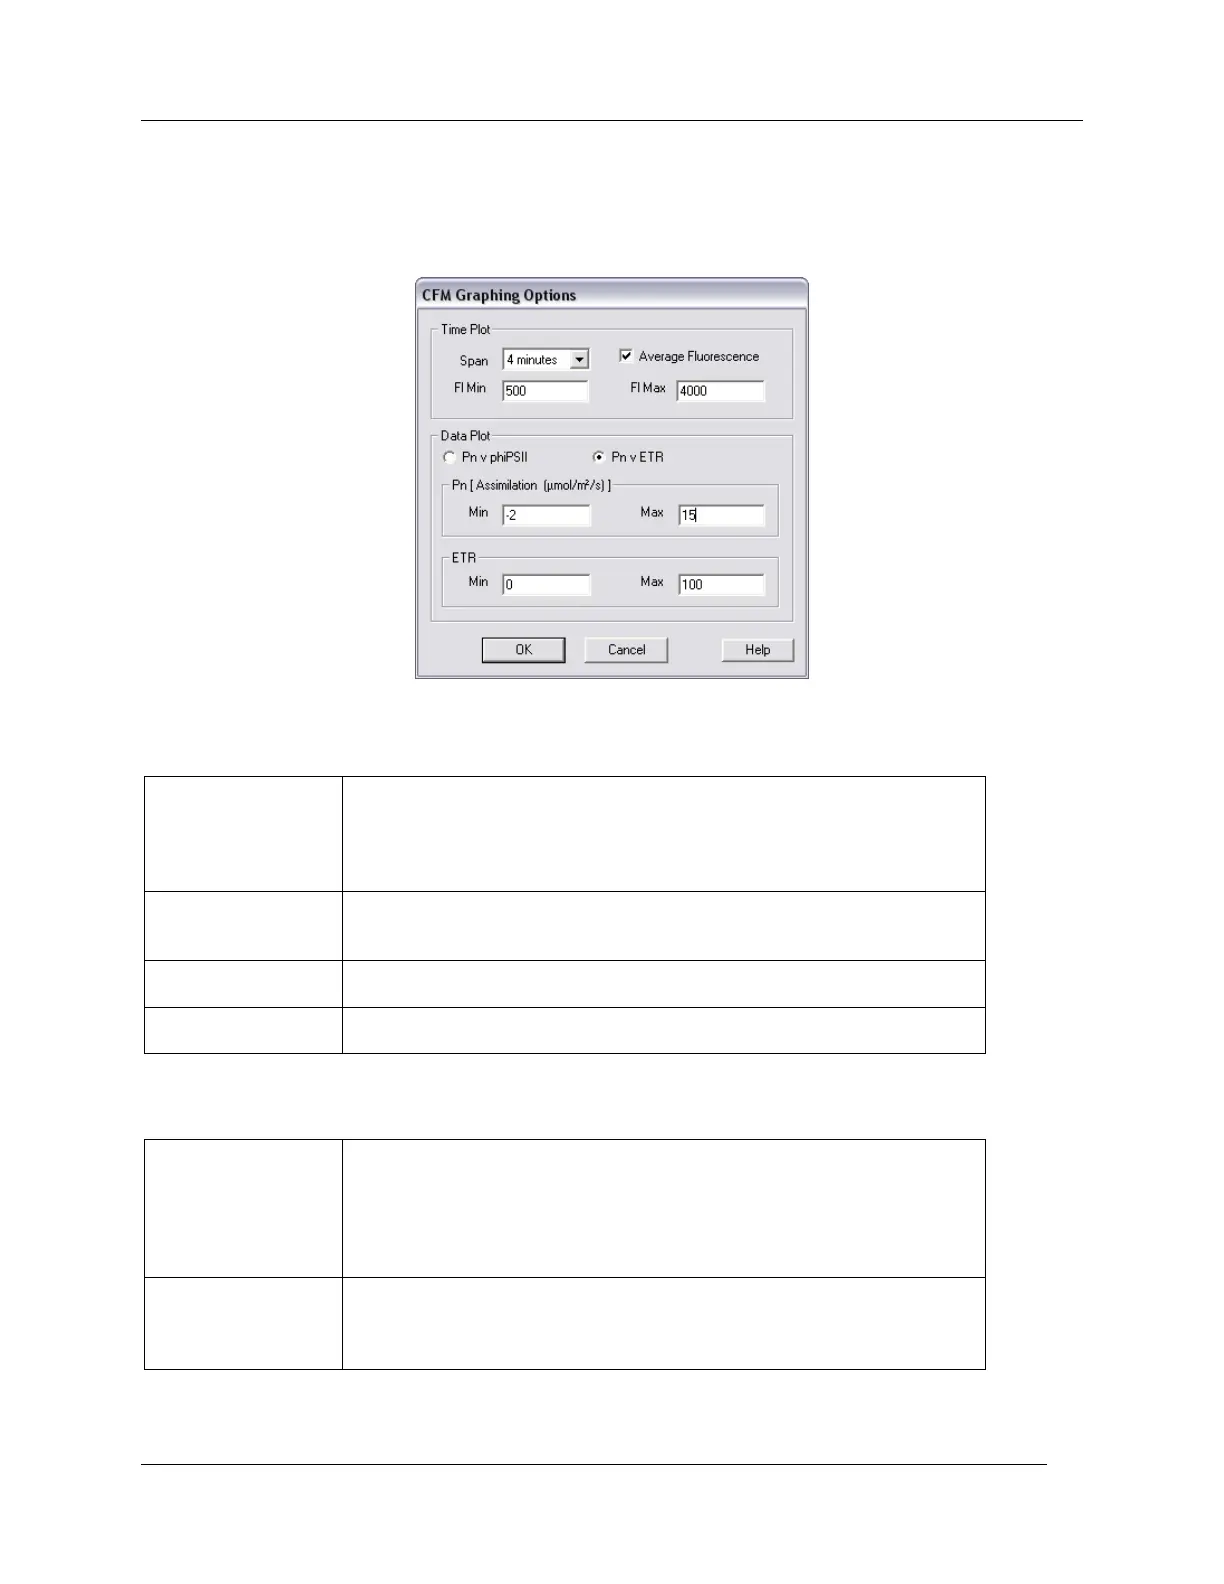
CFM Graphing Options
Allows the user to customize the CFM display in CIRAS-2. This function is also available within the main
CIRAS Graphing Preferences (Settings – Graph – Preferences).
CFM Time Plot
If selected, the average fluorescence is plotted as a green line. The
fluorescence signal is averaged every 1.6 seconds in order to
correspond with photosynthesis measurements. Note, average
fluorescence can also be plotted on the CIRAS display (one of four
possible parameters that can be selected.
Fluorescence data can be displayed over 2,3 and 4 minute time
intervals. In all cases, the last 1 minute is discarded when the full
span has been reached.
Maximum fluorescence setting (0-4000 bits) plotted against Span
(minutes)
Minimum fluorescence setting (0-4000 bits) plotted against Span
(minutes)
CFM Data Plot
When selected, a Pn (assimilation) record is taken and plotted against
phiPSII.
Pn range: 0-100
phiPSII range: 0.1 - 0.85.
When selected, a Pn (assimilation) record is taken and plotted against
ETR.
Pn range: 0-100
ETR range: 10 – 1000
CFM Graphing options are stored on a per definition basis within the .cfm settings files.