Observing and Recording Leaf Gas Exchange
CIRAS-2 Operator's Manual Version 2.04
- 73 -
Steady Pn Options
User-defined. If checked, enter an acceptable range of variability for net photosynthetic rate.
Automatic Response
Response Curve is automatic throughout the course of measurement.
Manual Response
Response Curve is manual throughout the course of measurement. The user must manually record data
and move to the next set level during course of response curve.
PAR Type - Use Sensor
Check this box if the PAR Sensor is to be used to measure and control light in the cuvette. If this box is
not ticked, PAR must be entered manually by the user to be included in measurements.
CO
2
Control Type
Both CO2 and H2O Control Types may be changed if desired. For CO
2
response curves we recommend
using the „Supply (Ref) Approximate ppm‟ type due to the time delay associated with the precision CO
2
control option. Refer to CO2 (0–2000 ppm) on page 51 for more details.
H
2
O Control Type
Refer to H2O (0-100% or 0 mb-Dewpoint) on page 51 for more details.
Light Type
Defaults to „Auto. Light Unit‟. See Light Type on page 45 for more details.
Temperature Control
Defaults to entered values (25 °C). See Temperature page 53 for more details.
Click OK to accept changes, then in the Response Editor save the Response file. Click Yes to Enter a
file name to save the Response Curve information. After entering a name, click on Save. Again, click
OK when the Select Recording Options dialog reappears. Finally, name and save the data file. After
creating the data file, the response curve measurement will begin.
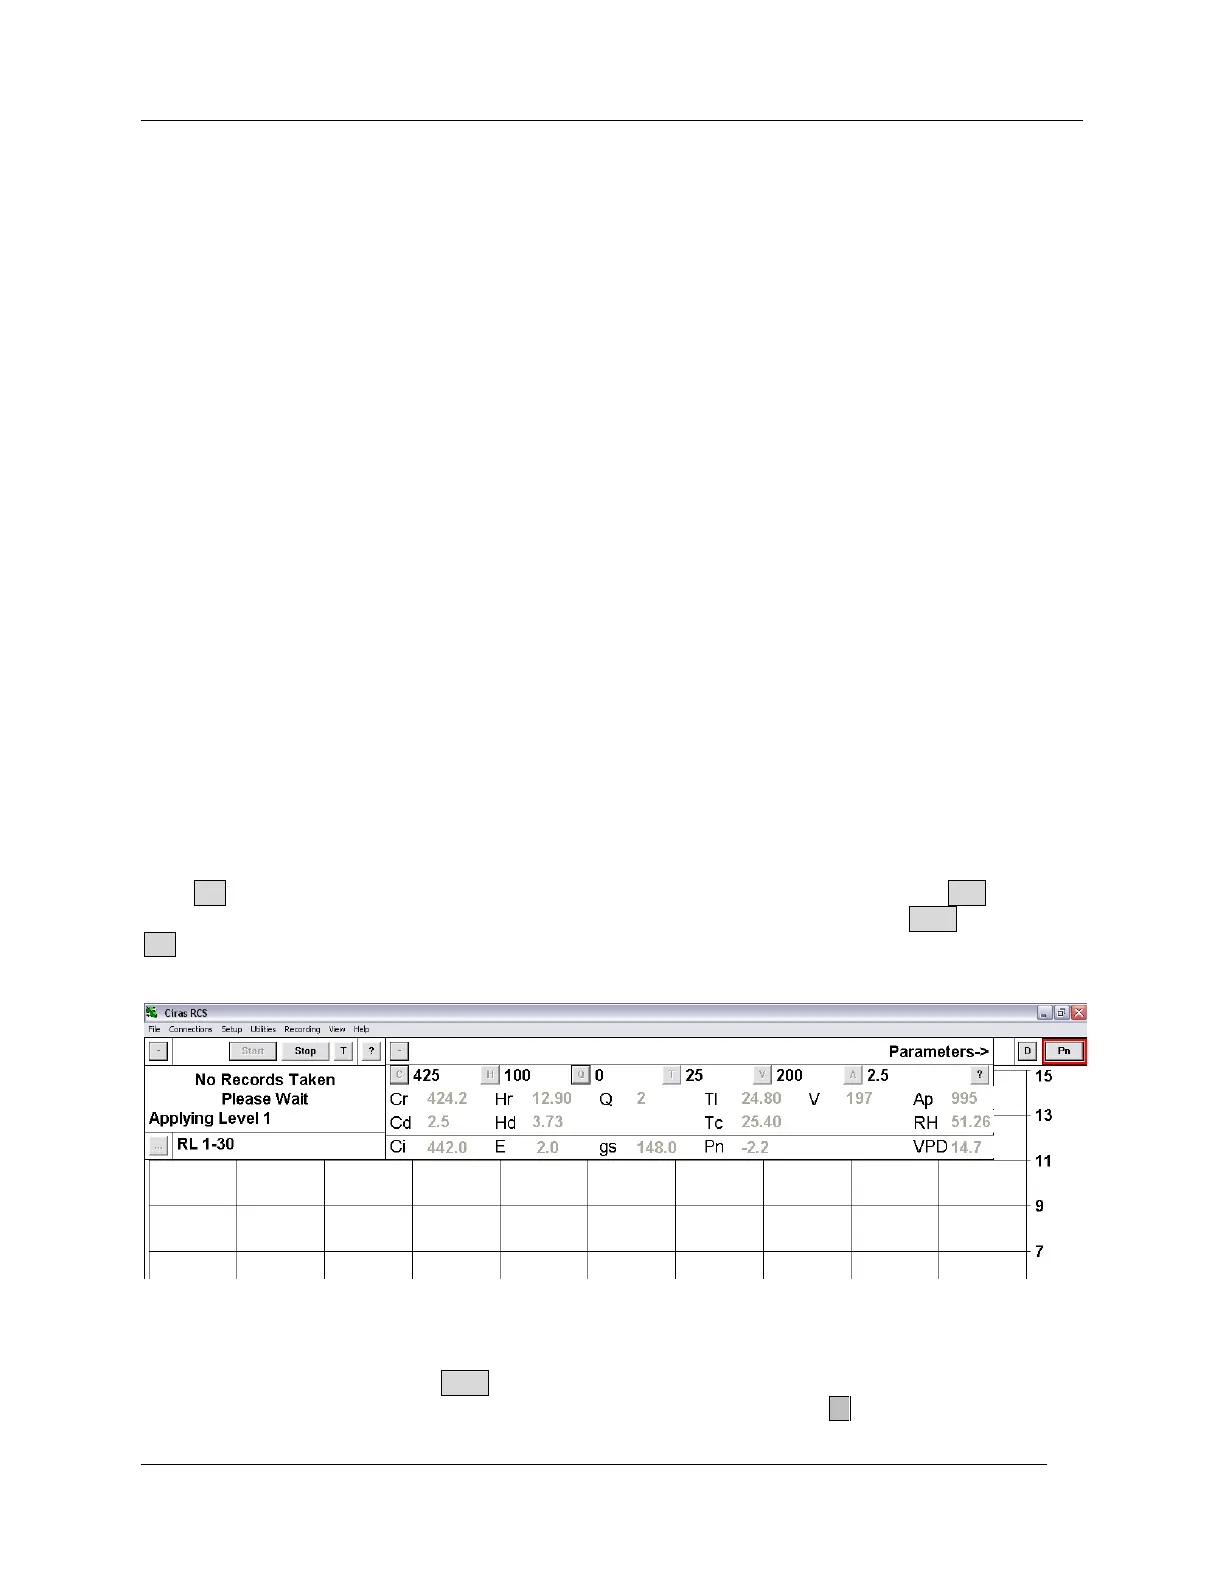
As in Timed Recording you will be prompted to ‟Press “Start” when steady‟. „RL 1-30‟ indicates that your
Response Curve is currently in the first of 30 selected levels (see image above). Wait until the values are
stable at Level 1, then press the Start button to begin an automatic response curve measurement. You
can review details of your Response Levels at any time by clicking on the … button in the Recording