Observing and Recording Leaf Gas Exchange
CIRAS-2 Operator's Manual Version 2.04
- 74 -
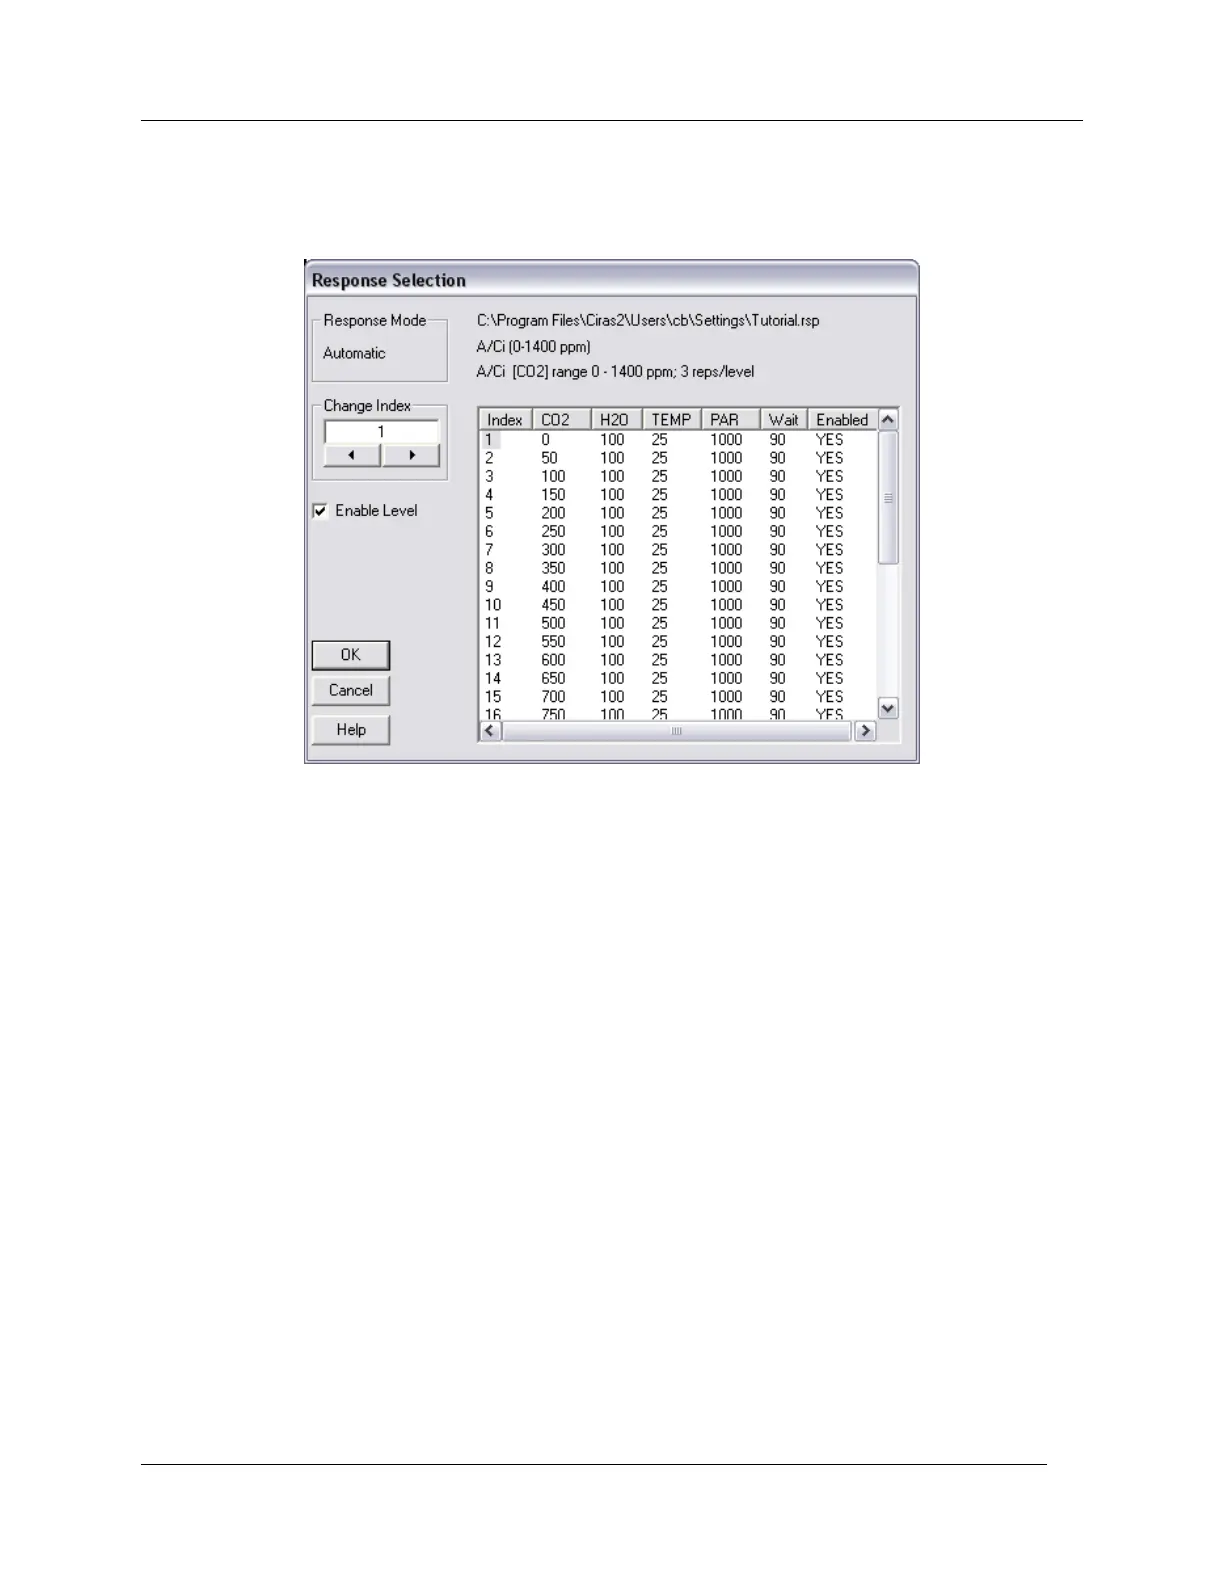
window (upper left) or from the CIRAS menu bar Recording – Response Level to expand the
Response Selection dialog. Here you can jump to or disable Response Levels – however, you cannot
edit Level values.
On page 75 is an example of what a typical CO
2
response curve might look like in the Time Plot: Pn (red)
and Cd (black) increase (in opposite directions) accordingly with upward CO
2
concentration changes
(green). Leaf responses stabilized (flattening of each curve) following transitory spikes associated with
CO
2
Level changes, with two measurements made after appropriate 90 second „Settle‟ times. The end of
Response Levels are marked by a light green vertical line. In the example, 15 Response Levels have
been completed – note „Settling for Level 16 [1:14 of 1:30m]‟ in upper left of display. The corresponding
Data Plot view of the A/Ci curve is also shown.
Please note: CIRAS-2 firmware is programmed to perform a Diff Bal whenever CO
2
concentration
changes exceed 100 ppm or H
2
O partial pressure exceeds 3 mb. Differential Balancing during a
Response Curve will automatically suspend the Response Level, requiring a short leaf reacclimation
period. This will be the case if you selected „Automatic‟ in the Zero/Diff Bal Mode option. To avoid this
you can store a set of values corresponding to your experimental range of CO
2
and H
2
O, and then select
„Auto Zero with Stored Diff Bal‟ in the Zero/Diff Bal Mode option (see Stored Diff Bal on page 78).