•Displaybasicordetailedinformationforeachtargetvessel
includingsafety-criticaltargetdata.
•Setupasafezonearoundyourboat.
•ViewAISalarmandsafetyrelatedmessages.
EnablingAISobjects
Inthechartapplication:
1.PressthePRESENTATIONsoftkey.
2.PresstheCHARTLAYERSsoftkey.
3.PresstheCHARTLAYERSsoftkey.
TheChartLayersmenuisdisplayed.
4.Usingthetrackpad,selecttheAISObjectsmenuitem.
5.PressthetrackpadrighttoselecttheONoption.
6.PresstheOKbutton.
Rangerings
Displayingrangeringsonthechartenablesyoutomeasure
distances.
Rangeringsgiveyouanincrementalrepresentationofdistance
fromyourvesseltohelpyoujudgedistancesataglance.Therings
arealwayscentredonyourvessel,andthescalevariestosuityour
currentzoomsetting.Eachringislabelledwiththedistancefrom
yourvessel.
Enablingrangerings
Inthechartapplication:
1.PressthePRESENTATIONsoftkey.
2.PresstheCHARTLAYERSsoftkey.
3.PresstheCHARTLAYERSsoftkey.
TheChartLayersmenuisdisplayed.
4.Usingthetrackpad,selecttheAISObjectsmenuitem.
5.PressthetrackpadrighttoselecttheONoption.
6.PresstheOKbutton.
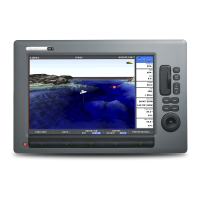
3Dchartviewlocator
Youcanshowa3Dviewlocatoronthe2Dcharttoindicatethe
boundariesoftheareacurrentlyshownonthe3Dchart.
The3Dviewlocatorisapolygonoutlinedinbluethatcanbe
overlayedonthe2Dchart.Asyourotateandpitchthevessel
symbolonthedisplay,orusethepanandzoomcontrols,theblue
polygonmovesonthe2Dcharttoindicatetheboundariesofthe
areacurrentlyshownonthe3Dchart.
Enablingthe3Dlocator
Inthechartapplication:
1.PressthePRESENTATIONsoftkey.
2.PresstheCHARTLAYERSsoftkey.
3.PresstheCHARTLAYERSsoftkey.
TheChartLayersmenuisdisplayed.
4.Usingthetrackpad,selectthe3DLocatormenuitem.
5.PressthetrackpadrighttoselecttheONoption.
6.PresstheOKbutton.
Chartvectors
Chartvectorsshowadditionalinformationonthechartdisplay,
includingheadingandCOGvectors,andwindandtidearrows.
Usingthechart
67
 Loading...


