63
5.4.4 Seismic Plots
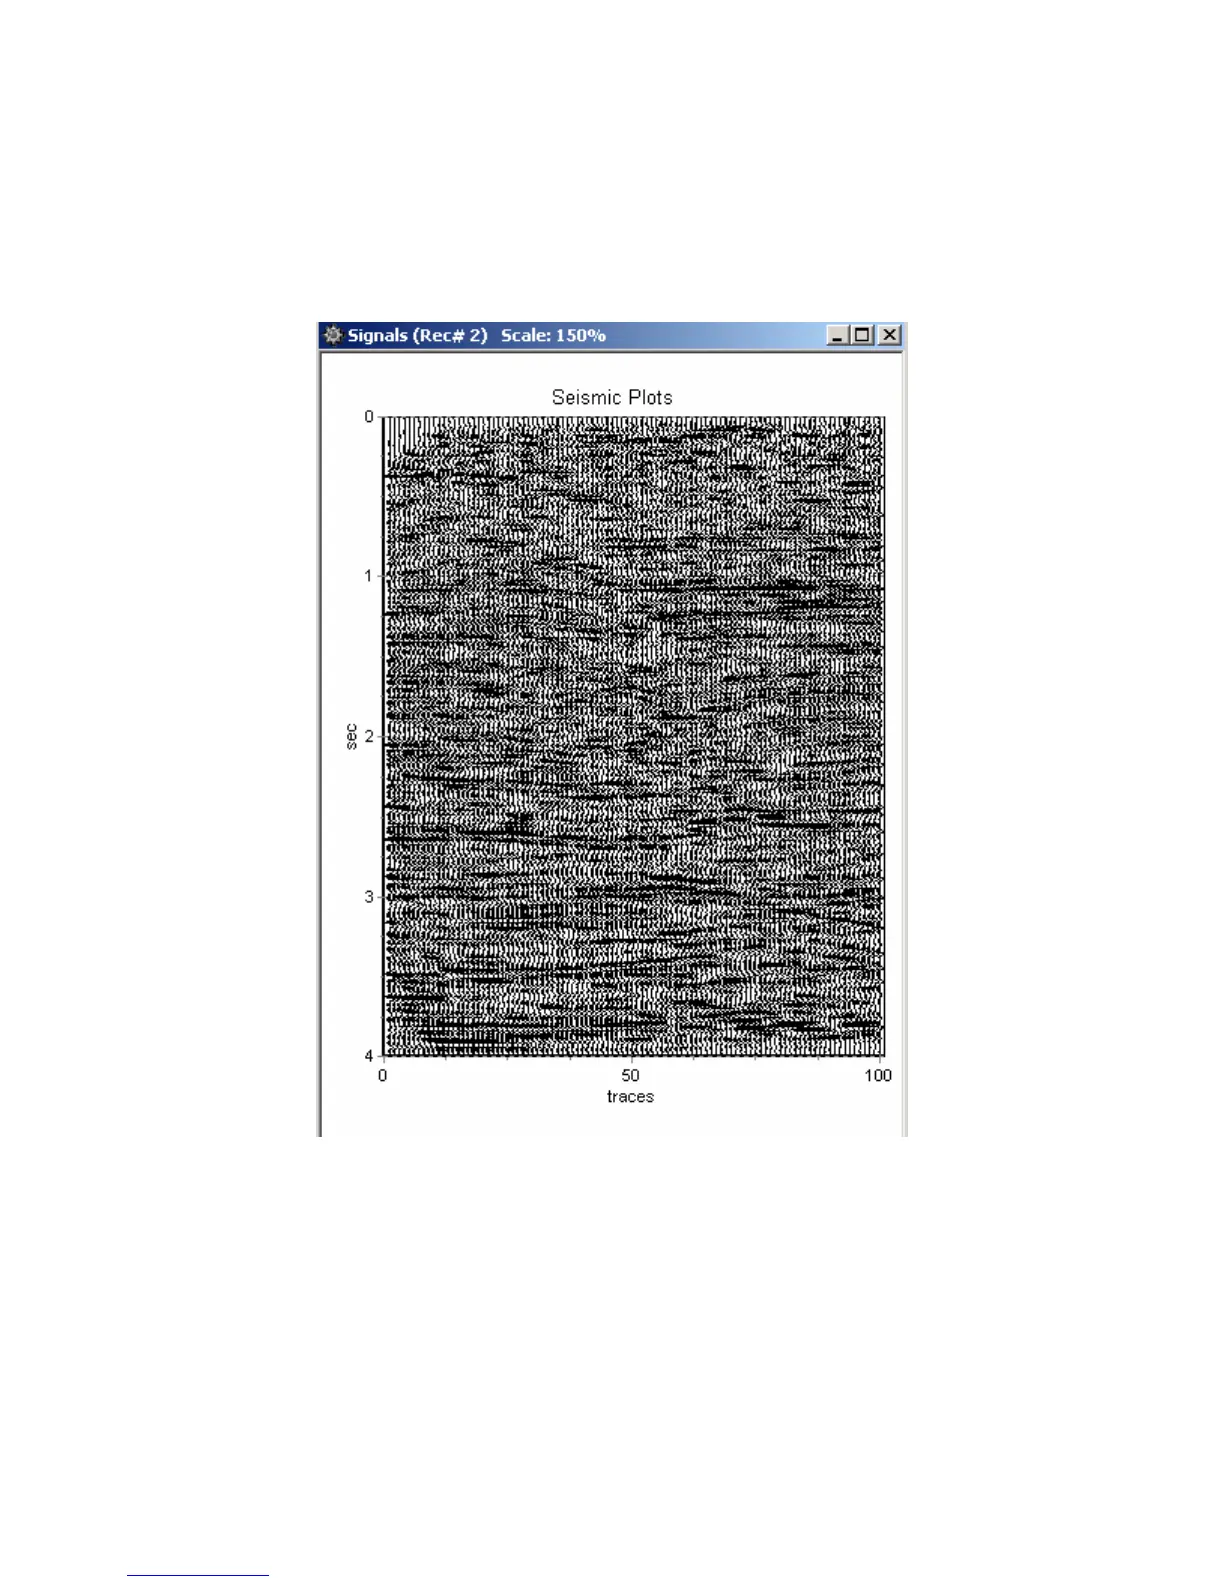
There is an additional option for a Seismic Plot. When the signal traces plot is selected,
the Seismic Plot option can be selected. The plot can be either Horizontal or Vertical. Also, the
peak of the signals can be clipped to allow better viewing of multiple channels with large gains.
Figure 5.4.4 Vertical Seismic Plot – The x-axis shows “Trace #”.
The Seismic Plots use special keys to control the gain and traces separation. The normal
Zoom and axis control used in the other plots do not work well with the Seismic plot.
The “+” key on the numeric keypad – increases gain of each trace.
The “-” key on the numeric keypad – decreases gain for each trace.
The “Ins” (Insert) key increases separation between traces.
The “Del” (Delete) key decreases separation between traces.