9
Event Analysis
SIMPRO-100
124 PRIM-2400C
9.7 Example Event
Report
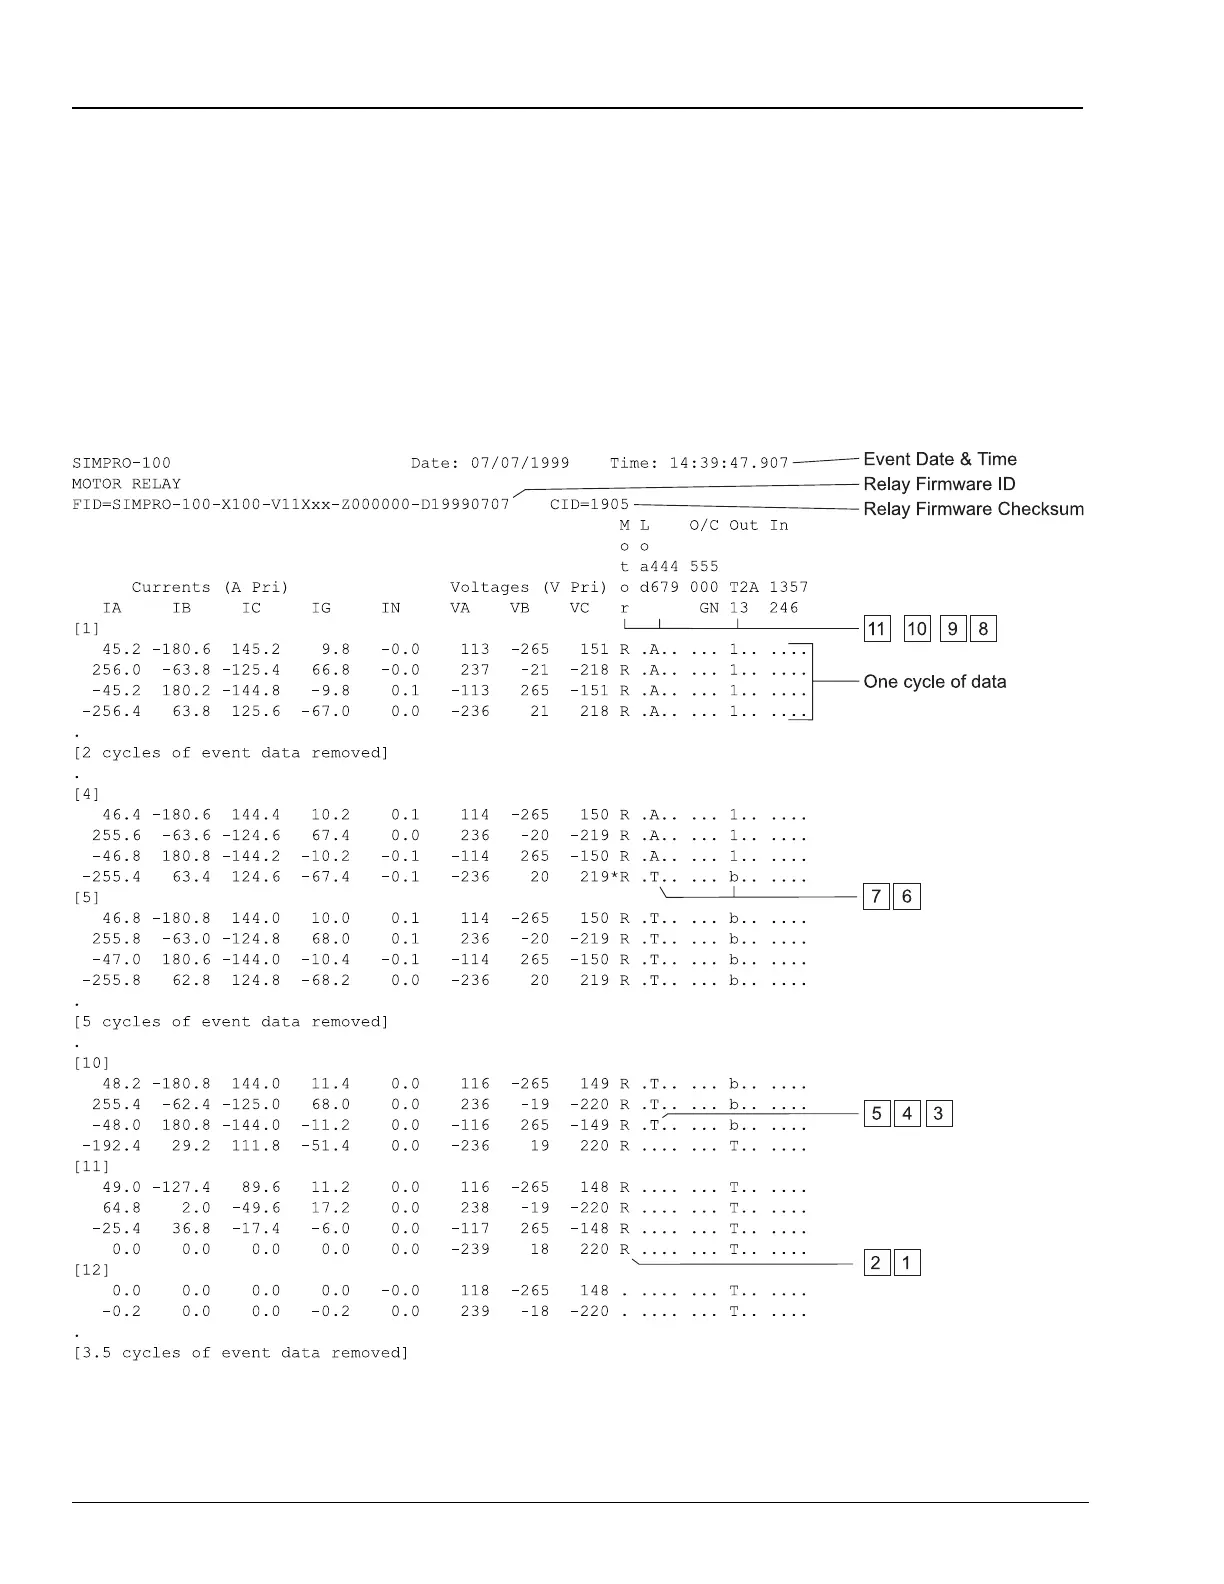
The example Event Report in Figure 9.1
corresponds to the example SER report in
Figure 9.2, page 125. The boxed numbers in
Figure 9.1 match the SER row numbers in
Figure 9.2. Row explanations follow Figure 9.2.
In Figure 9.1, the arrow (>) in the column
following the IN or Vc column identifies the
“trigger” row, the row that corresponds to the
Date and Time values at the top of the event
report.
The asterisk (*) in the column following the Vc
column identifies the row where the event
summary data was taken. If the “trigger” row (>)
and the summary row (*) are the same, the *
symbol takes precedence.
Figure 9.1 Example Event Report