EasyManuals Logo

SYNAPTICON SOMANET Node 400 User Manual

Default Icon
887 pages
To Next Page IconTo Next Page
To Previous Page IconTo Previous Page
Page #865 background imageLoading...
Page #865 background image
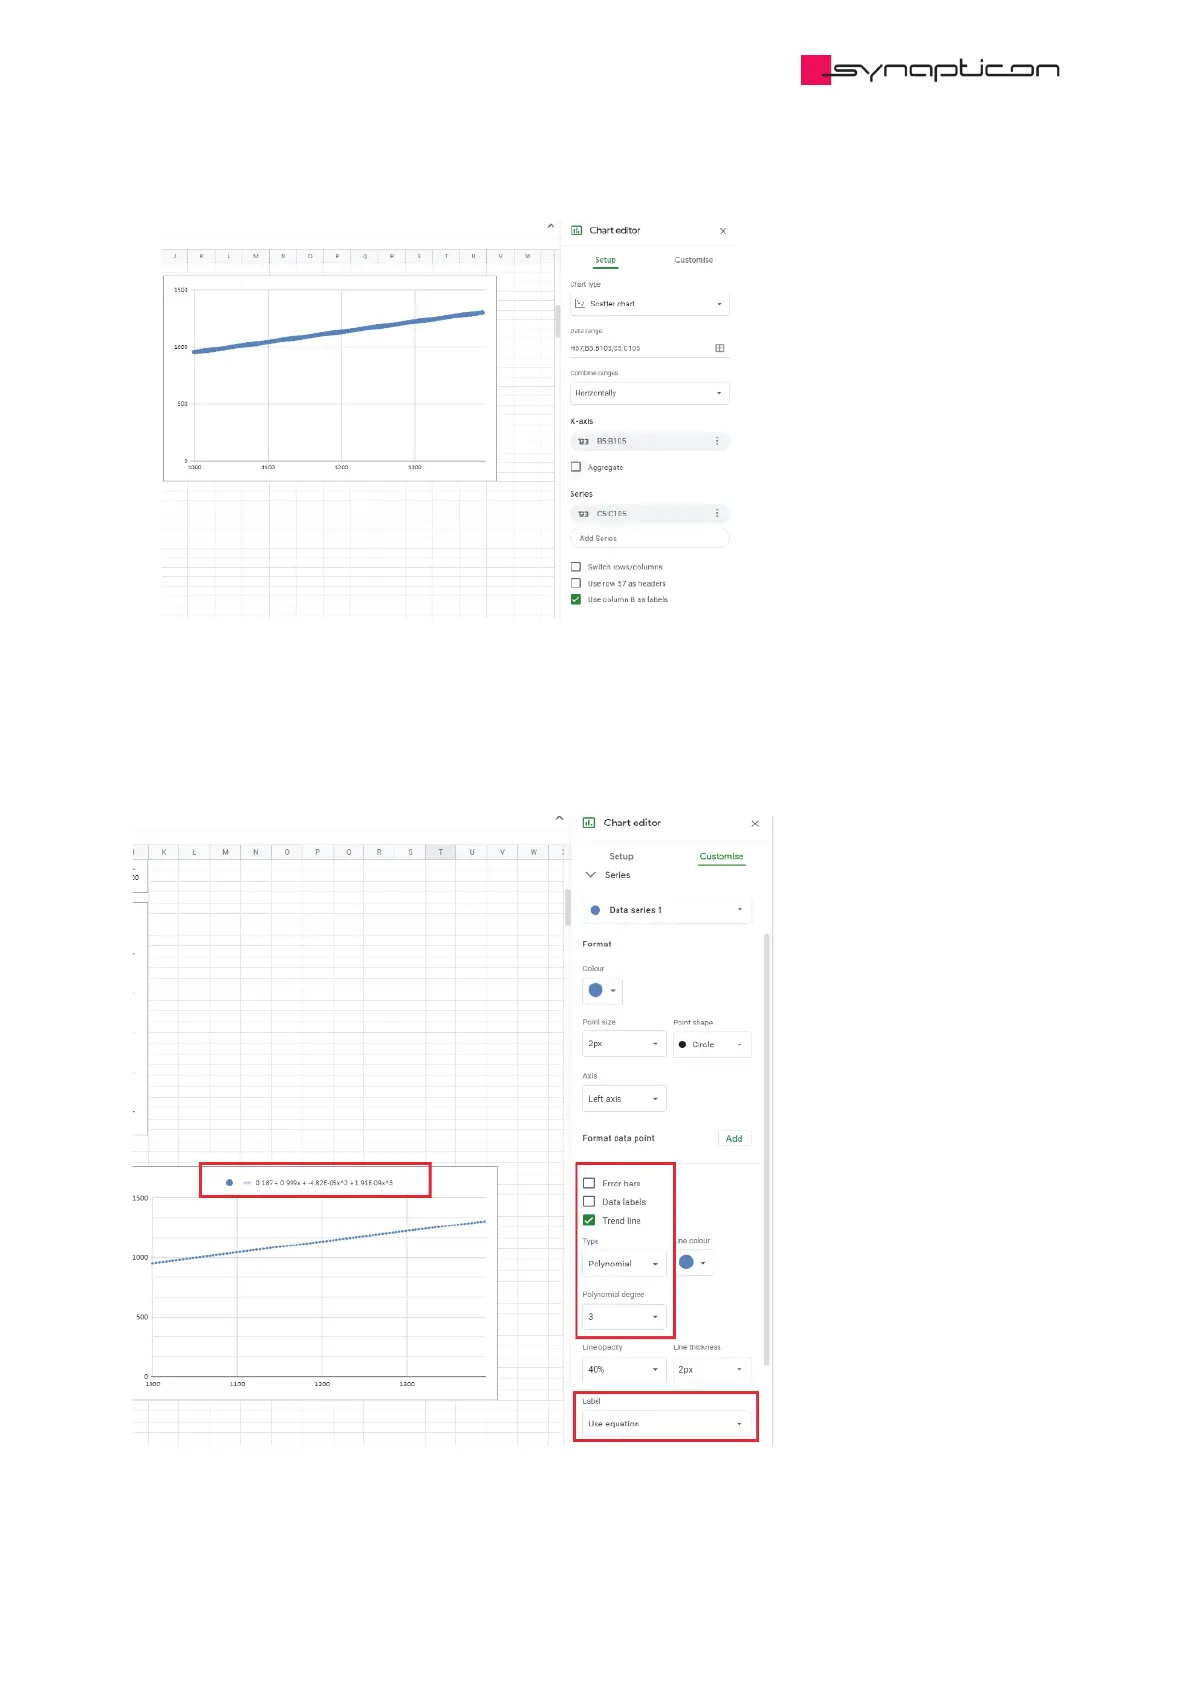
4 - In the chart editor menu select the series then select Trend lines.
5 - Then you can define the type of the line (polynomial) and polynomial degree.
6 - Use the equation as the label, then the polynomial function will appear on top of it.
Synapticon Documentation
© 2021 Synapticon GmbH | Daimlerstraße 26 | D-71101 Schönaich Documentation v 4.11.0 | Built 2021-07-23 865/887

Table of Contents

Other manuals for SYNAPTICON SOMANET Node 400

Questions and Answers:

Question and Answer IconNeed help?

Do you have a question about the SYNAPTICON SOMANET Node 400 and is the answer not in the manual?

SYNAPTICON SOMANET Node 400 Specifications

General IconGeneral
BrandSYNAPTICON
ModelSOMANET Node 400
CategoryServo Drives
LanguageEnglish

Related product manuals