CyFlow™ Ploidy Analyser | Operating Manual | October 2021
13.4.5 Plots
The Plots register shows and defines the individual plot properties.
Number, type (histograms, dot plots) and position of the plots are defined in the
configuration file.
Choose different Configuration files for different layouts.
Modification of Plots
Individual plots can be selected using the arrow keys.
[Alt] + Right-click within a plot shows the plot properties.
Confirm all modifications by pressing [Accept].
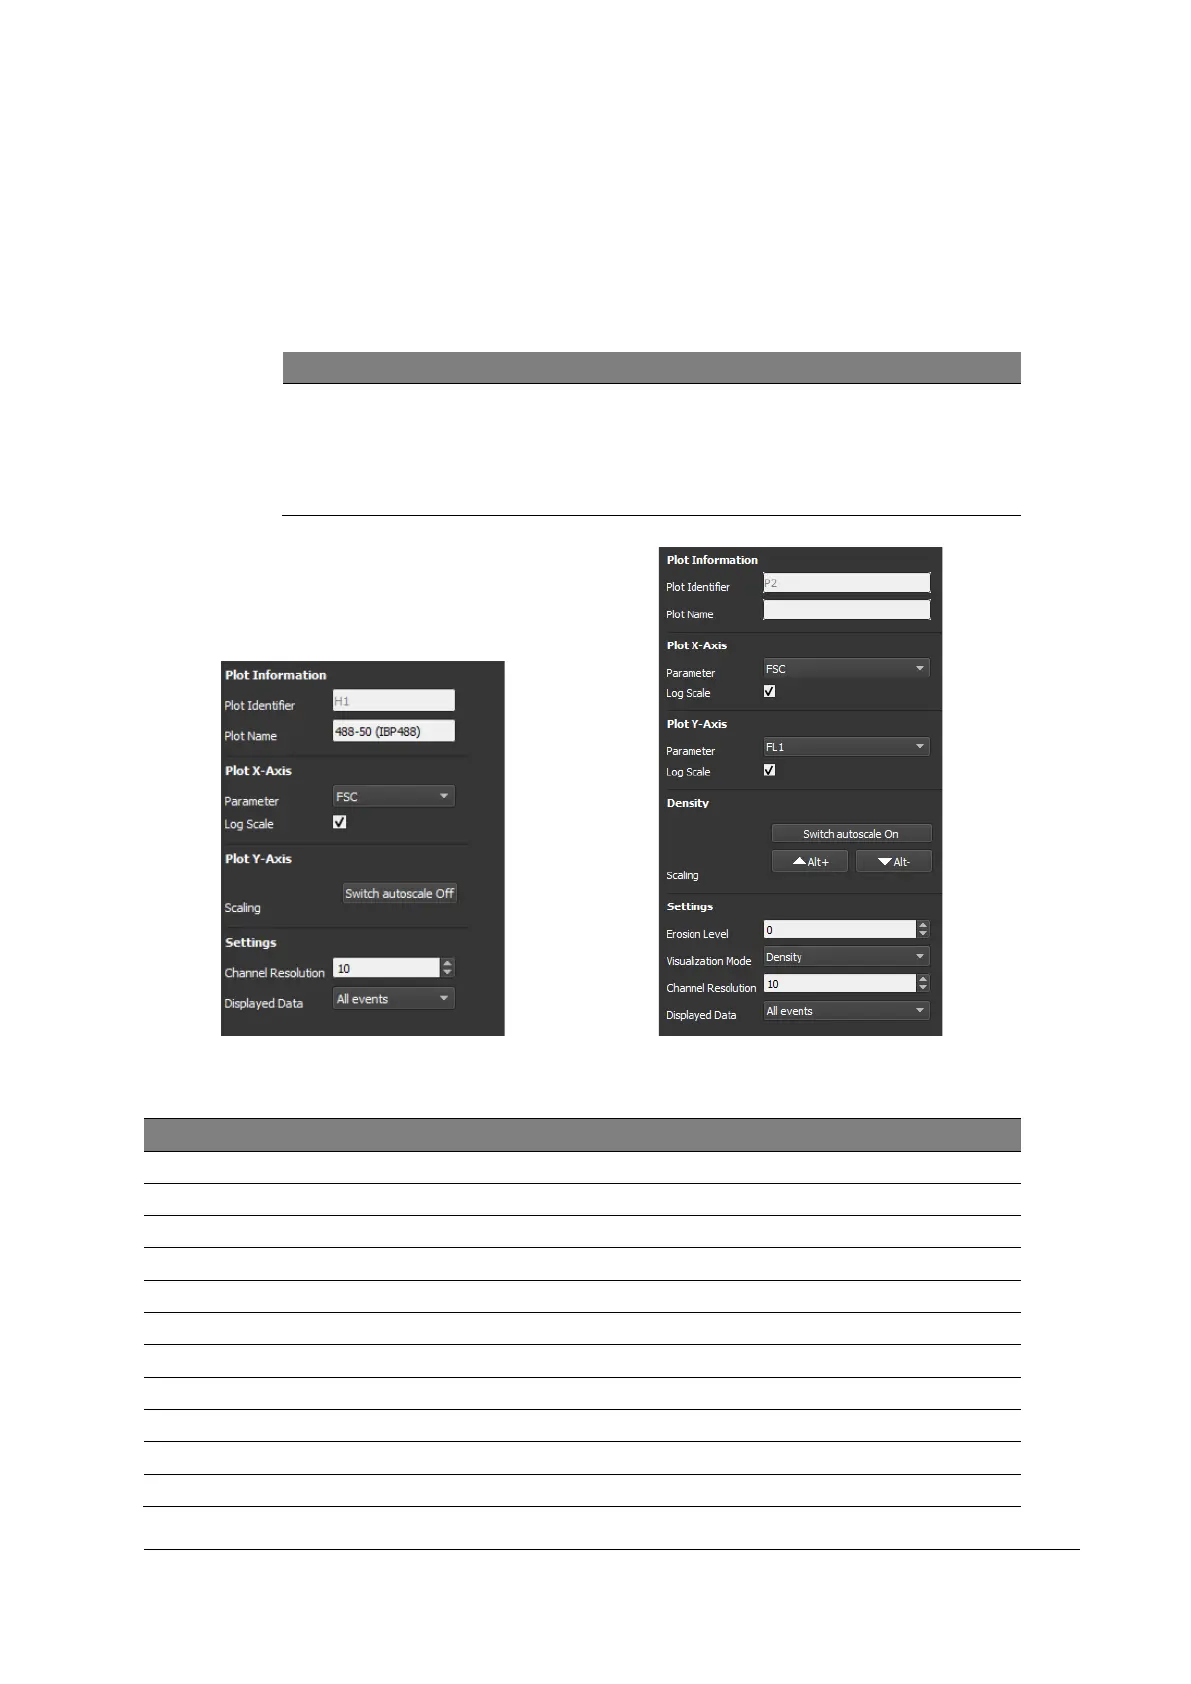
Figure 19: Plots register (Histogram)
Figure 20: Plots register (Dot plot)
Plot ID above dot plot / histogram
Defines the dot plot / histogram name (may be changed manually)
Parameter to be displayed on the x-axis
Changes the x-axis scaling from linear to logarithmic scale
Parameter to be displayed on the y-axis
Changes the y-axis scaling from linear to logarithmic scale
Switches autoscaling of the y-axis on/off