CyFlow™ Ploidy Analyser | Operating Manual | October 2021
Gating
Gates are used select an specific area in order to investigate and to quantify these
populations of interest.
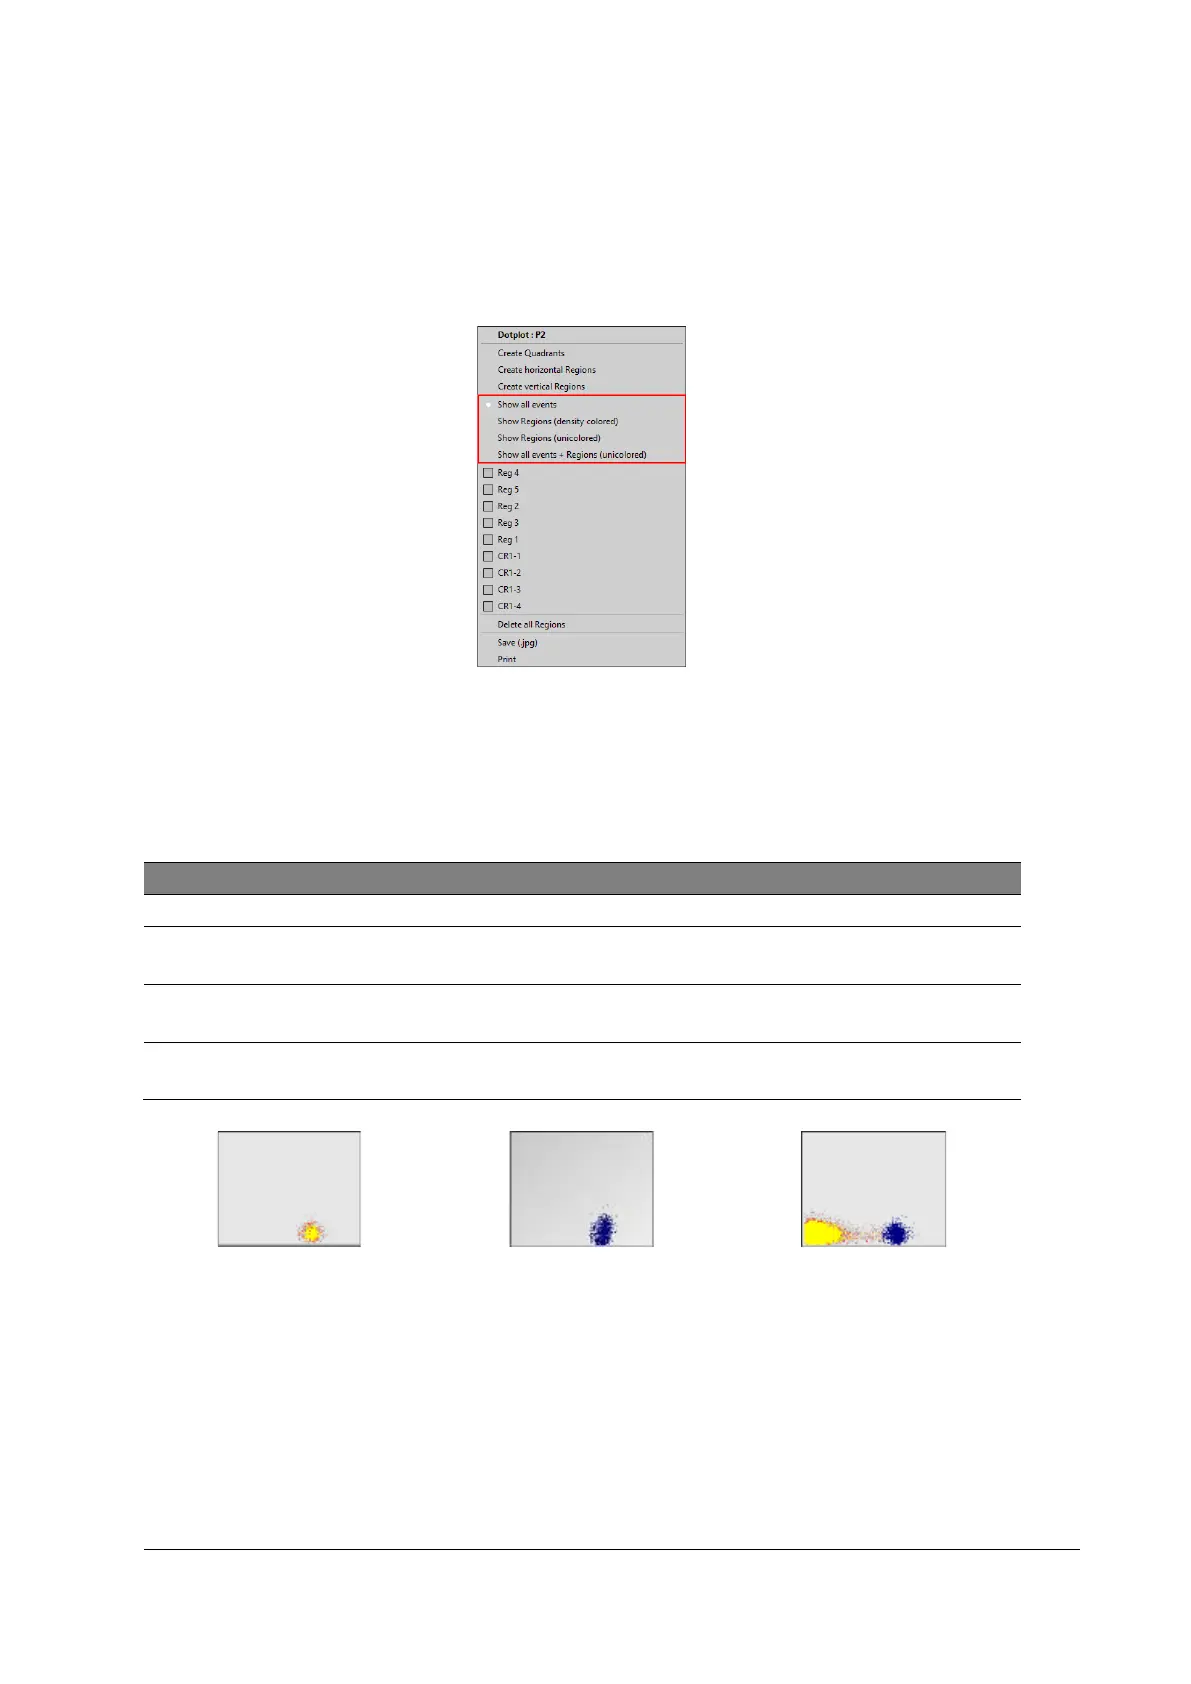
Figure 25: Display options
Procedure
1. Right-click in a histogram or dot plot (outside of a region).
2. Select any existing region (Reg 1-Reg x) which is labelled with [Color gating on].
3. Choose display option.
Displays all events in pseudo 3D color
Show Regions
(density colored)
Displays events in the selected region(s) in pseudo 3D color
Show Regions
(unicolored)
Displays the events in the selected region(s) in the region color
Show all events +
Regions (unicolored)
Displays the events in the selected region(s) in color together
with all events in pseudo 3D color
Figure 26: Show Regions (density
colored)
Figure 27: Show Regions (unicolored)
Figure 28: Show all events + Regions
(unicolored)