Automated gating
The CyFlow™ Ploidy Analyser has options to automatically recognize peaks on a
histogram for ploidy analysis.
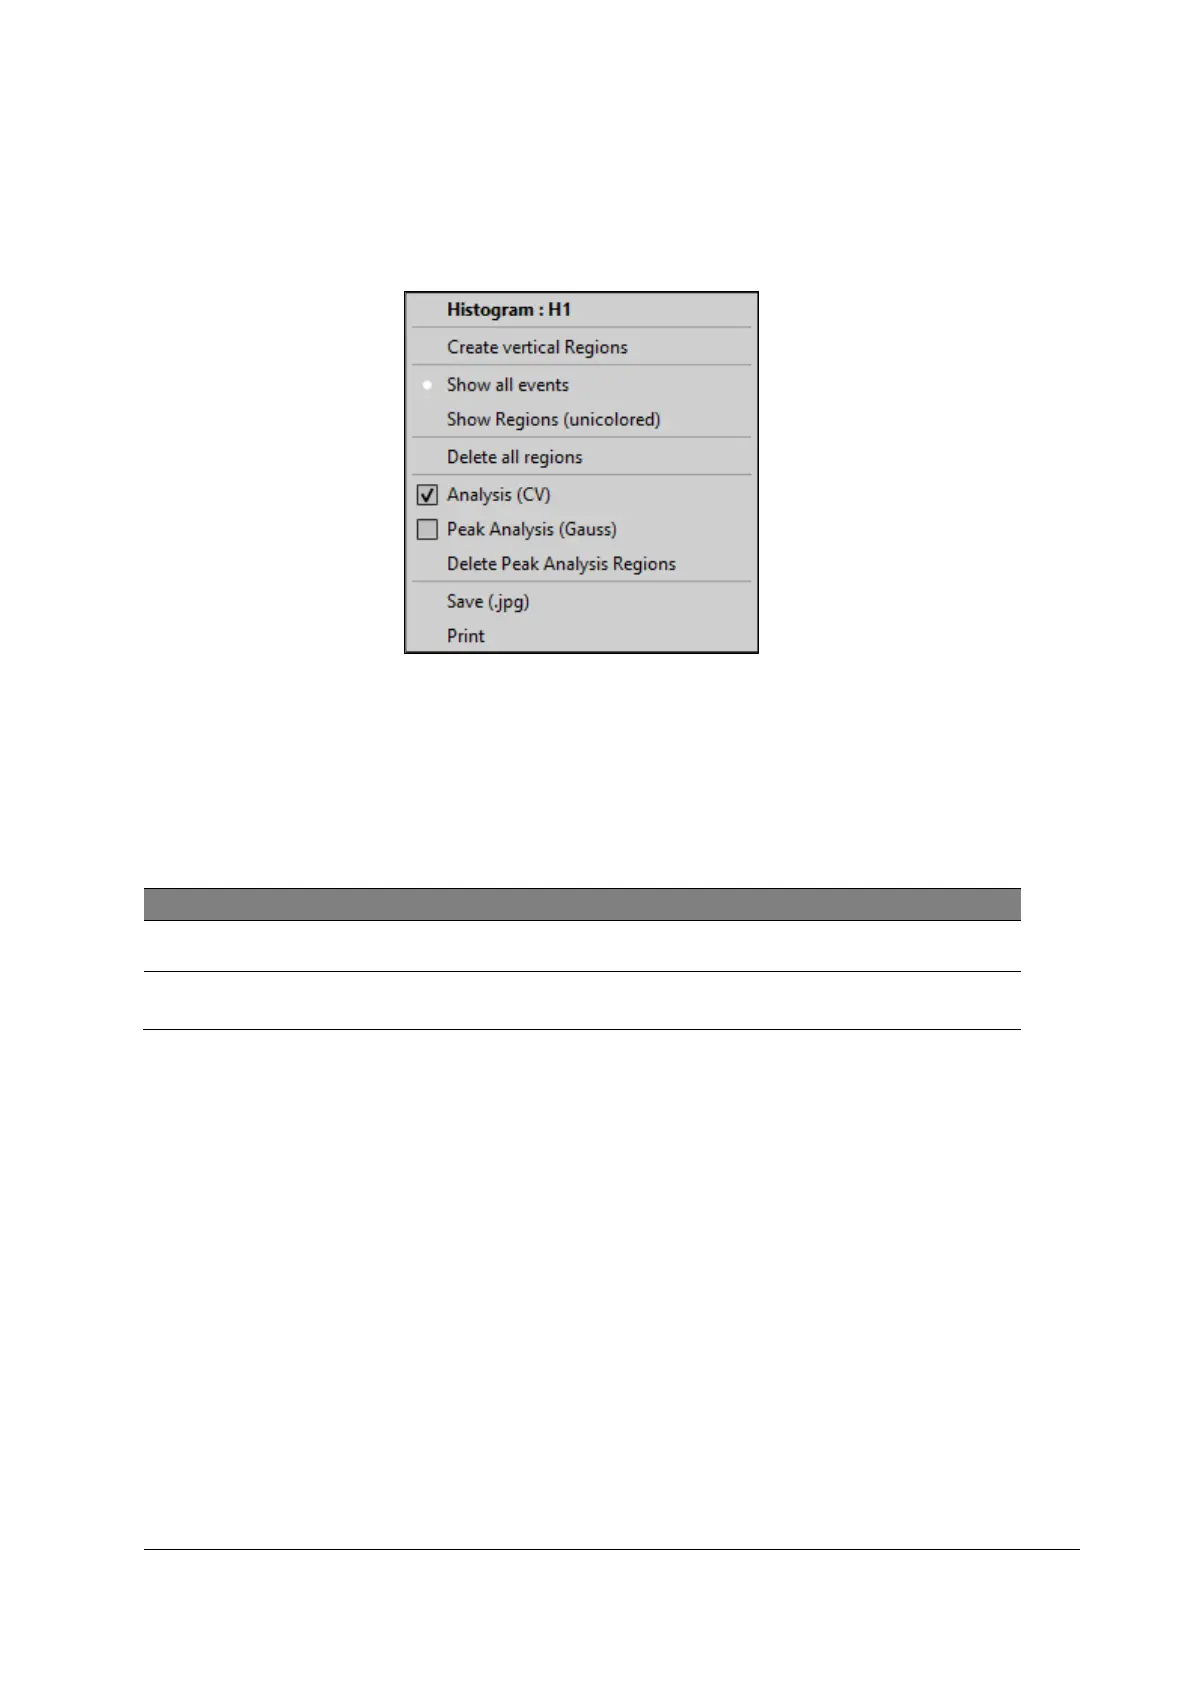
Figure 29: Analysis options
Procedure
1. Right-click in a histogram (outside of a region).
2. For automated peak detection, select Analysis (CV) or Peak Analysis (Gauss).
Will run an algorithm for a Gaussian data fit, peak recognition
and label the recognized peak area in blue.
Detected peak areas will be labelled PN1, PN2, PNX… . Additional regions can be added
manually to a 1-parameter histogram (Reg1, Reg2, RegX …).and will be displayed light
red and blue, respectively.
[Delete Peak Analysis Regions] deletes all peak analysis regions.
With an active Autoflag on [AutoPA] (register card [Measure]) the selected peak analysis
mode (Analysis (CV) / Peak-Analysis (Gauss)) will be automatically triggered after a
measurement is started.
In the Peak Analysis Result Table shows statistical data of automatically detected and
manually selected peak areas (PNx, Regx).