49
9.6.6.Logarithmic Output (GI-M2)
Voltage values on order of several mV are low in accuracy because the
recorder output is 12-bit DAC.
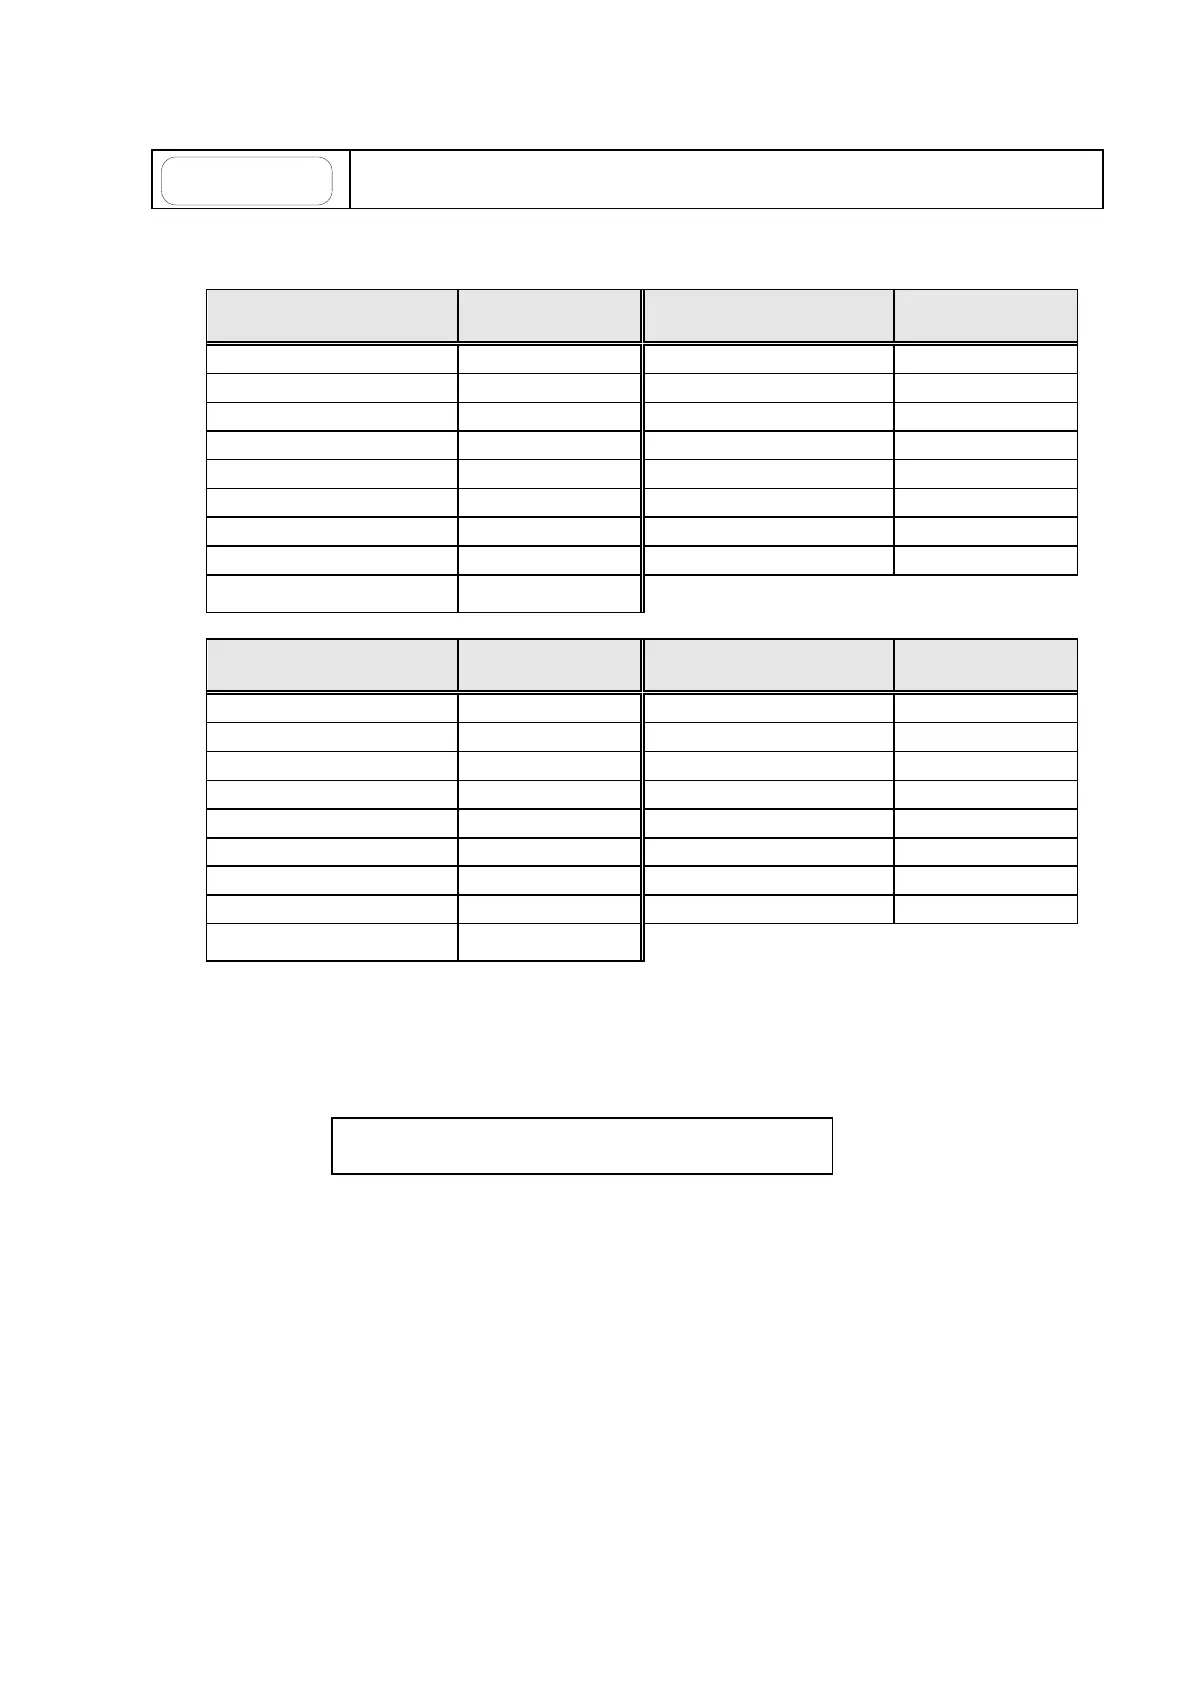
The table below gives the relationship between pressure and output voltage.
Table. 9-9 Measurement value outputs (GI-M2)
Displayed pressure
value (Pa)
Displayed pressure
value (Pa)
9.90×10
-0
9.00 1.00×10
-4
4.00
1.00×10
-0
8.00 5.00×10
-5
3.70
5.00×10
-1
7.70 1.00×10
-5
3.00
1.00×10
7.00 5.00×10
2.70
5.00×10
-2
6.70 1.00×10
-6
2.00
1.00×10
-2
6.00 5.00×10
-7
1.70
5.00×10
5.70 1.00×10
1.00
1.00×10
-3
5.00 5.00×10
-8
0.70
5.00×10
-4
4.70
Displayed pressure
value (Torr)
Displayed pressure
value (Torr)
7.40×10
-2
8.87 1.00×10
-6
4.00
1.00×10
-2
8.00 5.00×10
-7
3.70
5.00×10
-3
7.70 1.00×10
-7
3.00
1.00×10
-3
7.00 5.00×10
-8
2.70
5.00×10
-4
6.70 1.00×10
-8
2.00
1.00×10
-4
6.00 5.00×10
-9
1.70
5.00×10
-5
5.70 1.00×10
-9
1.00
1.00×10
-5
5.00 3.00×10
-10
0.48
5.00×10
-6
4.70
The measurement output voltage can be converted to a pressure value using the following
equation.
P: Pressure value (Pa)
V: Measured output voltage (V)