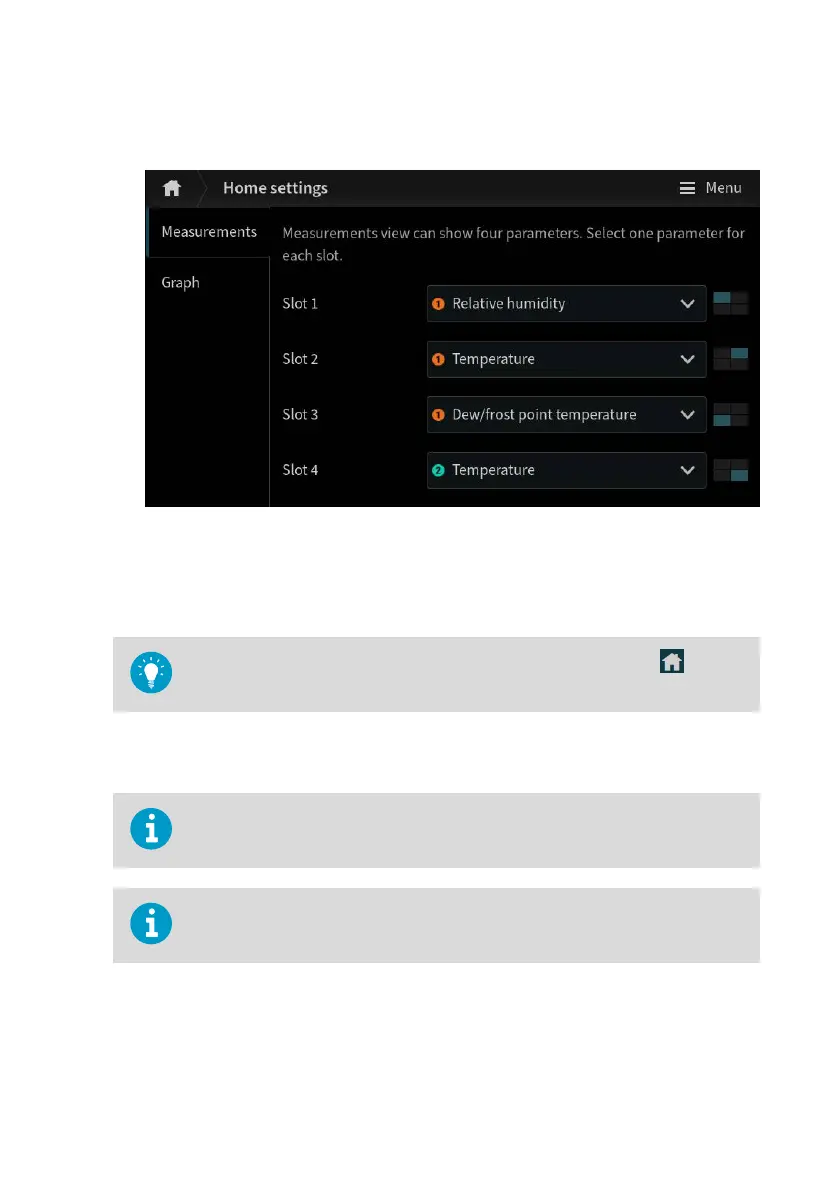
3. In the Measurements tab, in Slot 1 ... 4, select which parameters are shown in the dierent
slots in the Measurements view.
4. In the Graph tab, define what is shown in the Graph view:
a. In Slot 1 ... 2, select the parameters to show on the graph.
b. In Graph scale, select the time scale for the graph.
To see the changes you made, return to the Home views by selecting .
6.3 Configuring analog outputs on touchscreen
If your transmitter is delivered with preconfigured analog outputs, you do not
need to configure the outputs manually.
Analog outputs are not available in transmitters that are powered with Power
over Ethernet (PoE).
The transmitter has 4 analog current (mA) or voltage (V) outputs.
Before you start, make sure that the probes you want to use are connected to the transmitter.
Chapter 6 – Configuring transmitter using touchscreen display
75
 Loading...