8
62
8 - Curves
You will now see the rst curve in chart form. At this stage
you can select any of the nine other curves to edit them.
Some of the curves will have names, while the others are
simply called Curve 4, Curve 5, etc. Click on a name to
open the curve to edit it. All congured curves have an
asterisk * after the name.
You can use drag-and-drop to move
the breakpoints around in the chart.
Click Save when you have nished.
To change more advanced settings,
click the Curve settings button. Here,
you can change the name, the axis
labels and scaling and the number of
breakpoints, and you can also enter
the breakpoints in table form.
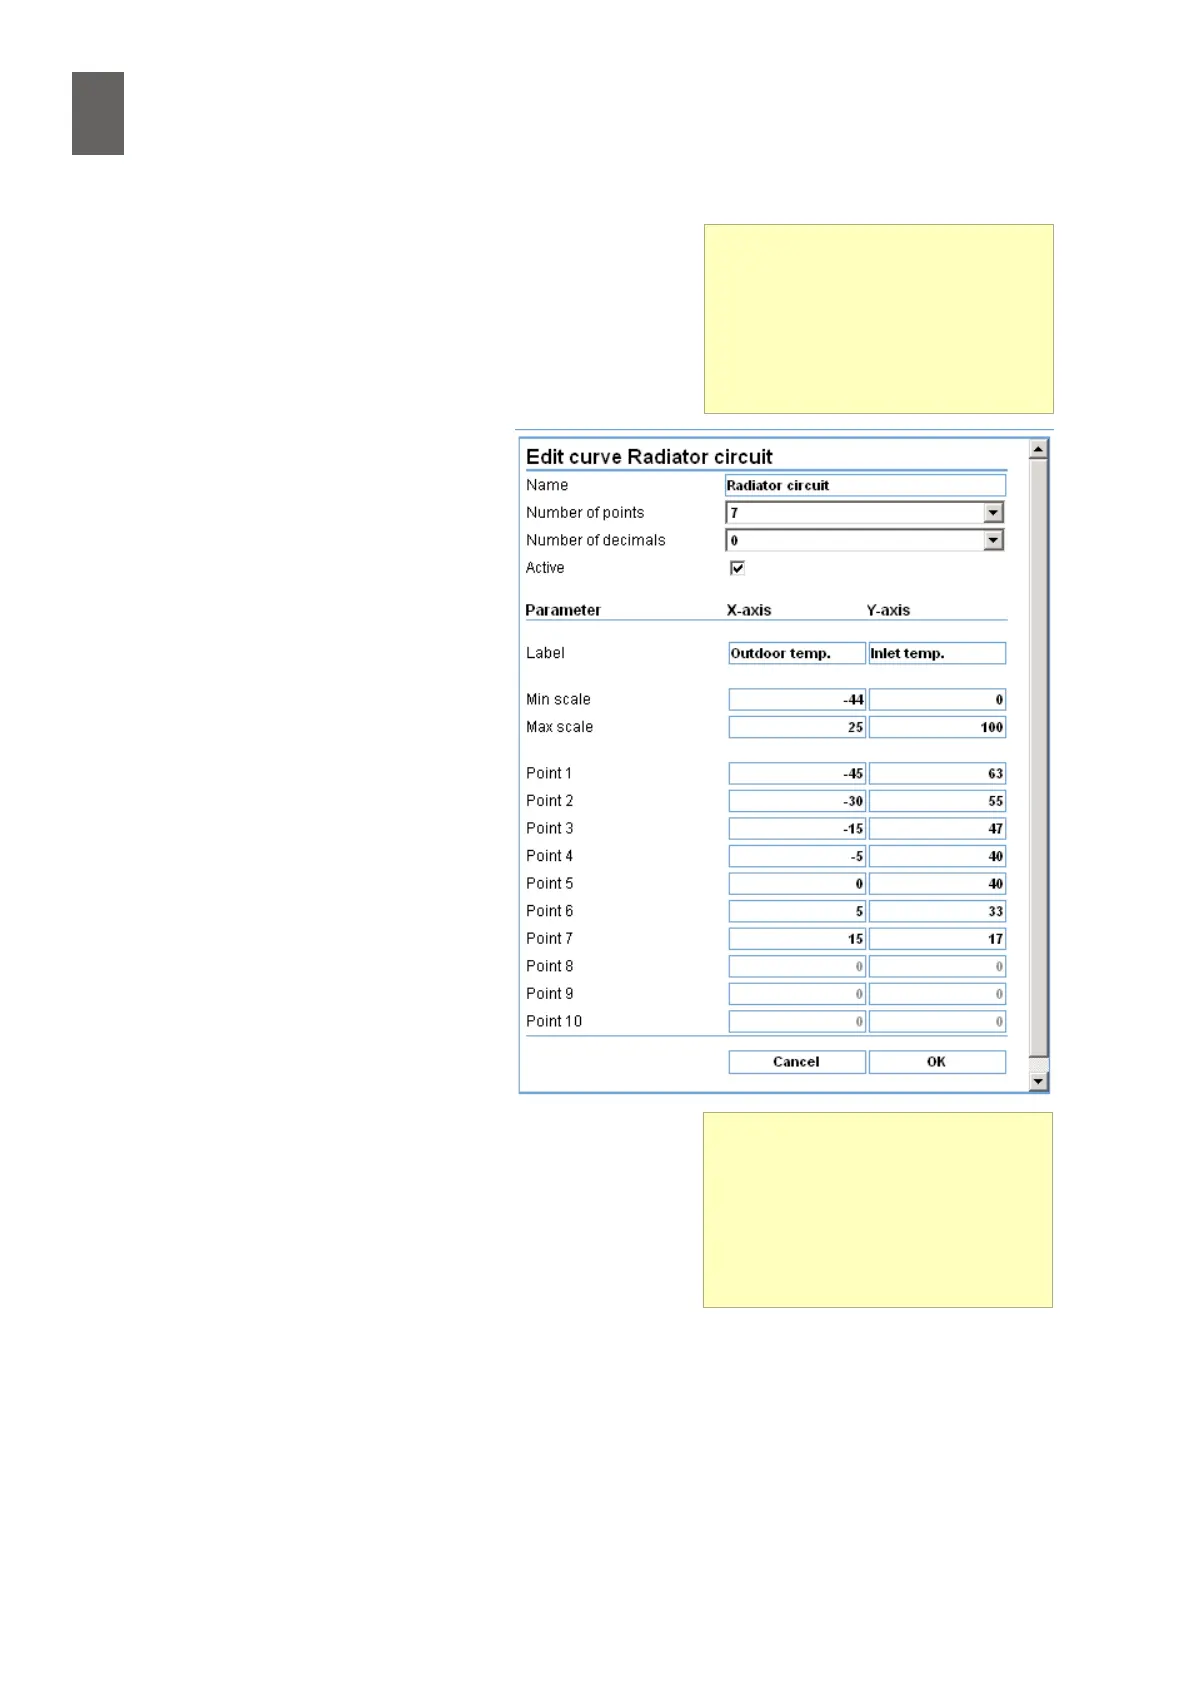
8�1�3 Example conguration
In this example we will view and
modify the curve we created when we
congured the controller in section 6.
The curve was named Radiator circuit.
Start by clicking "Radiator circuit" and
then Curve settings.
We are going to change the name,
add new labels and change the axis
scaling. We will also set the number of
breakpoints to 7, specify no decimal
places and enter the breakpoints into
a table. It should be obvious how to
do this. See the screenshot on the
previous page.
Click OK to save. You are returned to the chart page, where
you can check the changes you have made.
Curve tool
You can nd the curve tool in the
advanced settings. Expand the
Settings menu by clicking Ad-
vanced. Then select Curves.
New curve
If you select a curve that has not
been edited before, it only has two
breakpoints. If you want more,
click the Curve settings button and
specify how many you need.