10
73
10 - Databases
10 Databases
10�1 Databases
The WMPro has three standard databases. There is a short time data-
base that saves a value every second. And there is an hour database
and a day database, which save a value every hour and every day
respectively. When you congure inputs and outputs, you can choose
whether to save the value to a database. The hour and day databases
provide a range of options such as mean values over a period, mini-
mum and maximum values, etc. You can also save other information
to the database, but this involves more advanced functions which are
described in the reference manual.
You can either view the databases directly in the browser in the form
of charts, or you can download them for further processing in pro-
grams like Excel.
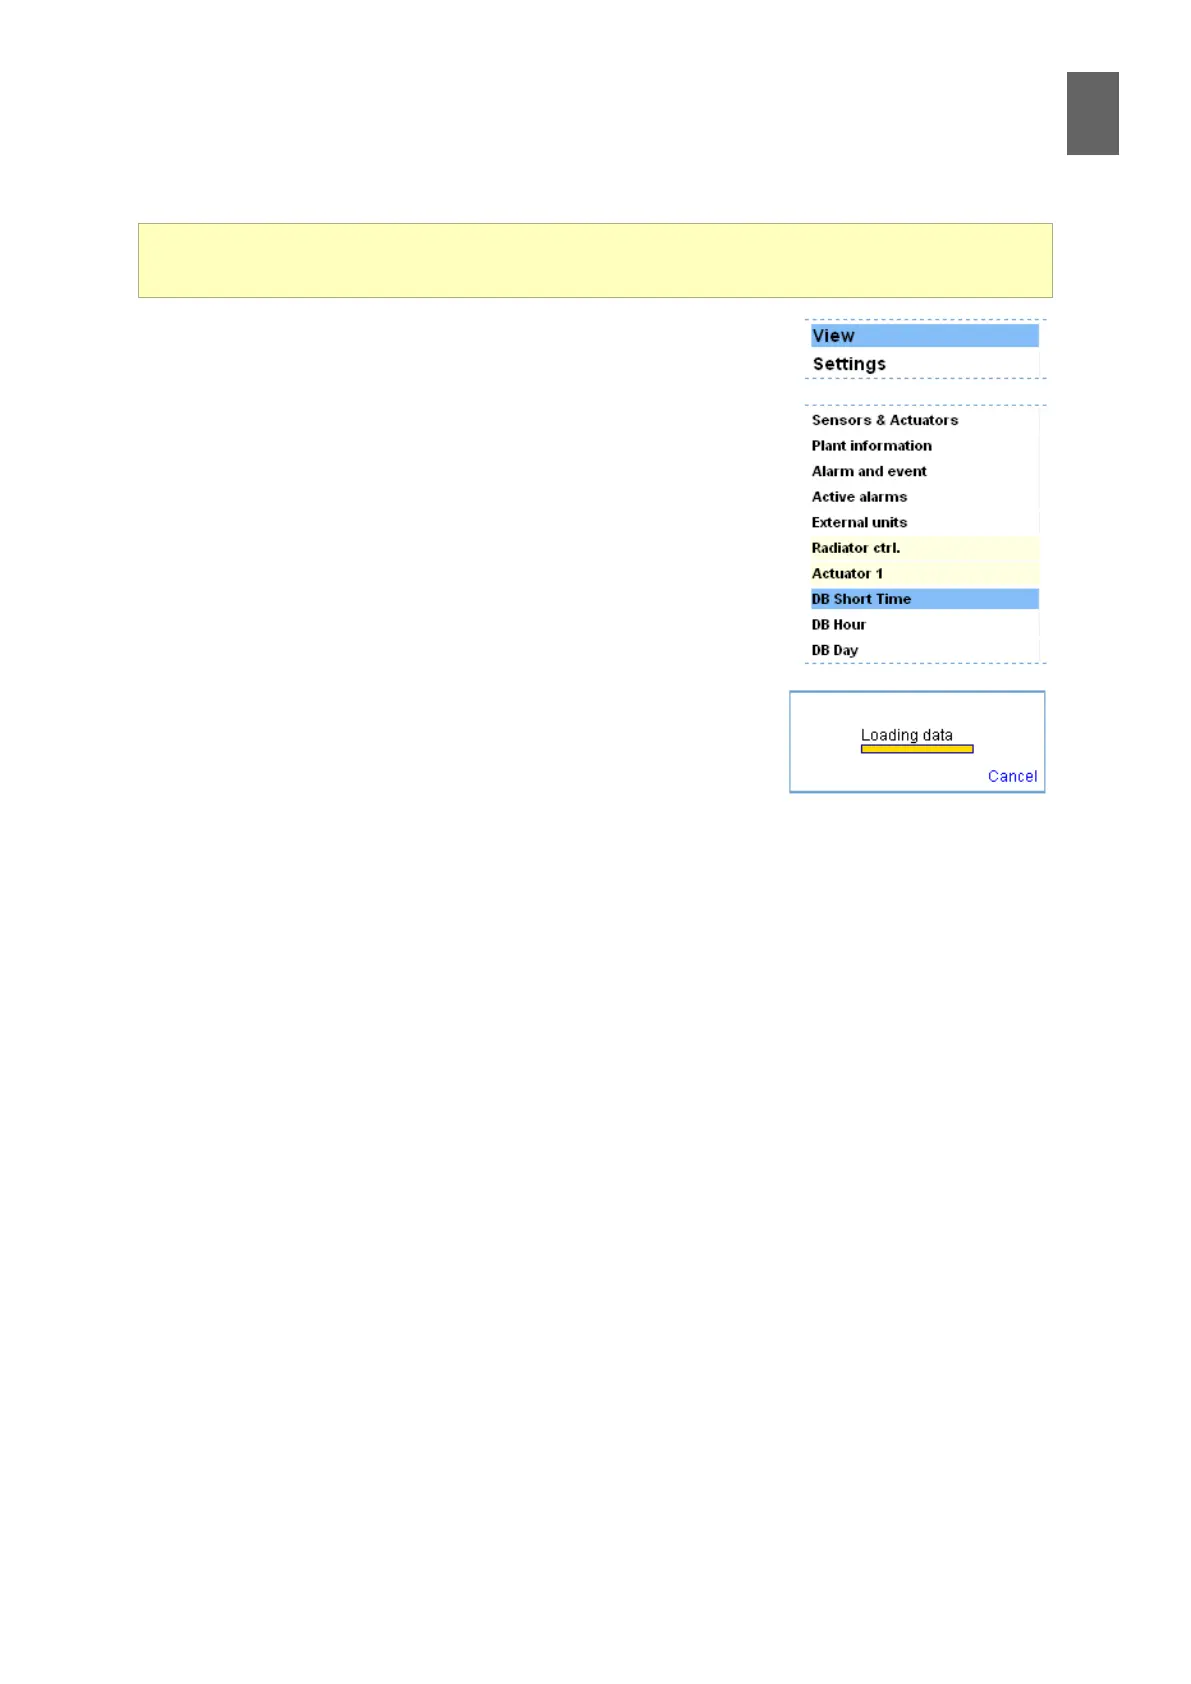
10�1�1 Viewing in the browser
Open one of the databases. For example the short time database.
The most recently viewed channels are loaded. It might take a while
to import all the data to the browser. If you want to view a dierent
channel, you can stop the download by clicking Cancel in the small progress indicator.
You can display up to three channels simultaneously in the browser. Select the channels you want to
view. Specify how much of the database you want to view. The higher the percentage, the longer it
will take to import the le. Choose whether you want to use multiple Y-axes. For example to display
the control signal to an actuator – about 5 V – as well as the return temperature in the district heat-
ing network – about 100 degrees – it will not be possible to show the variations in the control signal
using the same scale on the Y-axis. In this situation you would use multiple axes, giving each chan-
nel its own Y-axis with dierent scaling. When you have nished changing the settings, click Update.
The curves will appear after a few moments.
10�1�2 Zooming into the chart
To zoom in, click and drag down and right. The chart is redrawn with new X and Y-axes. To zoom
out, click and drag in the opposite direction – up and left. The chart is scaled down according to the
dierence in the size between the two rectangles. Click the Reset button to restore the chart to its
original scale.
The databases contain a history of the data in the system, and they can be used to generate sta-
tistics. This section explains how you can choose the information displayed.