8
63
8 - Curves
8�1�4 Editing a new curve
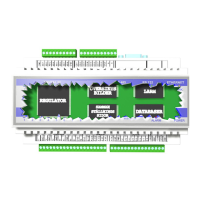
Select a curve that has not been edited before, for example Curve 4. On the chart page, you can see
there are only two breakpoints. In most scenarios, this will not be enough. To add more breakpoints,
click Curve settings and enter the number you need. Rename the curve, type the labels and the
breakpoint values, and nally check the Active box before clicking Save.
8�2 Sequence curves
If a ventilation controller has actuators in a number of sequences, a curve is created for each se-
quence. A sequence curve has at least three breakpoints, and describes how the output signal from
the controller is apportioned for the particular actuator. You can specify whether the sequence is a
cooling sequence or a heating sequence, whether to create dead zones, etc. You can include up to
10 breakpoints, allowing you to construct a non-linear curve if necessary.
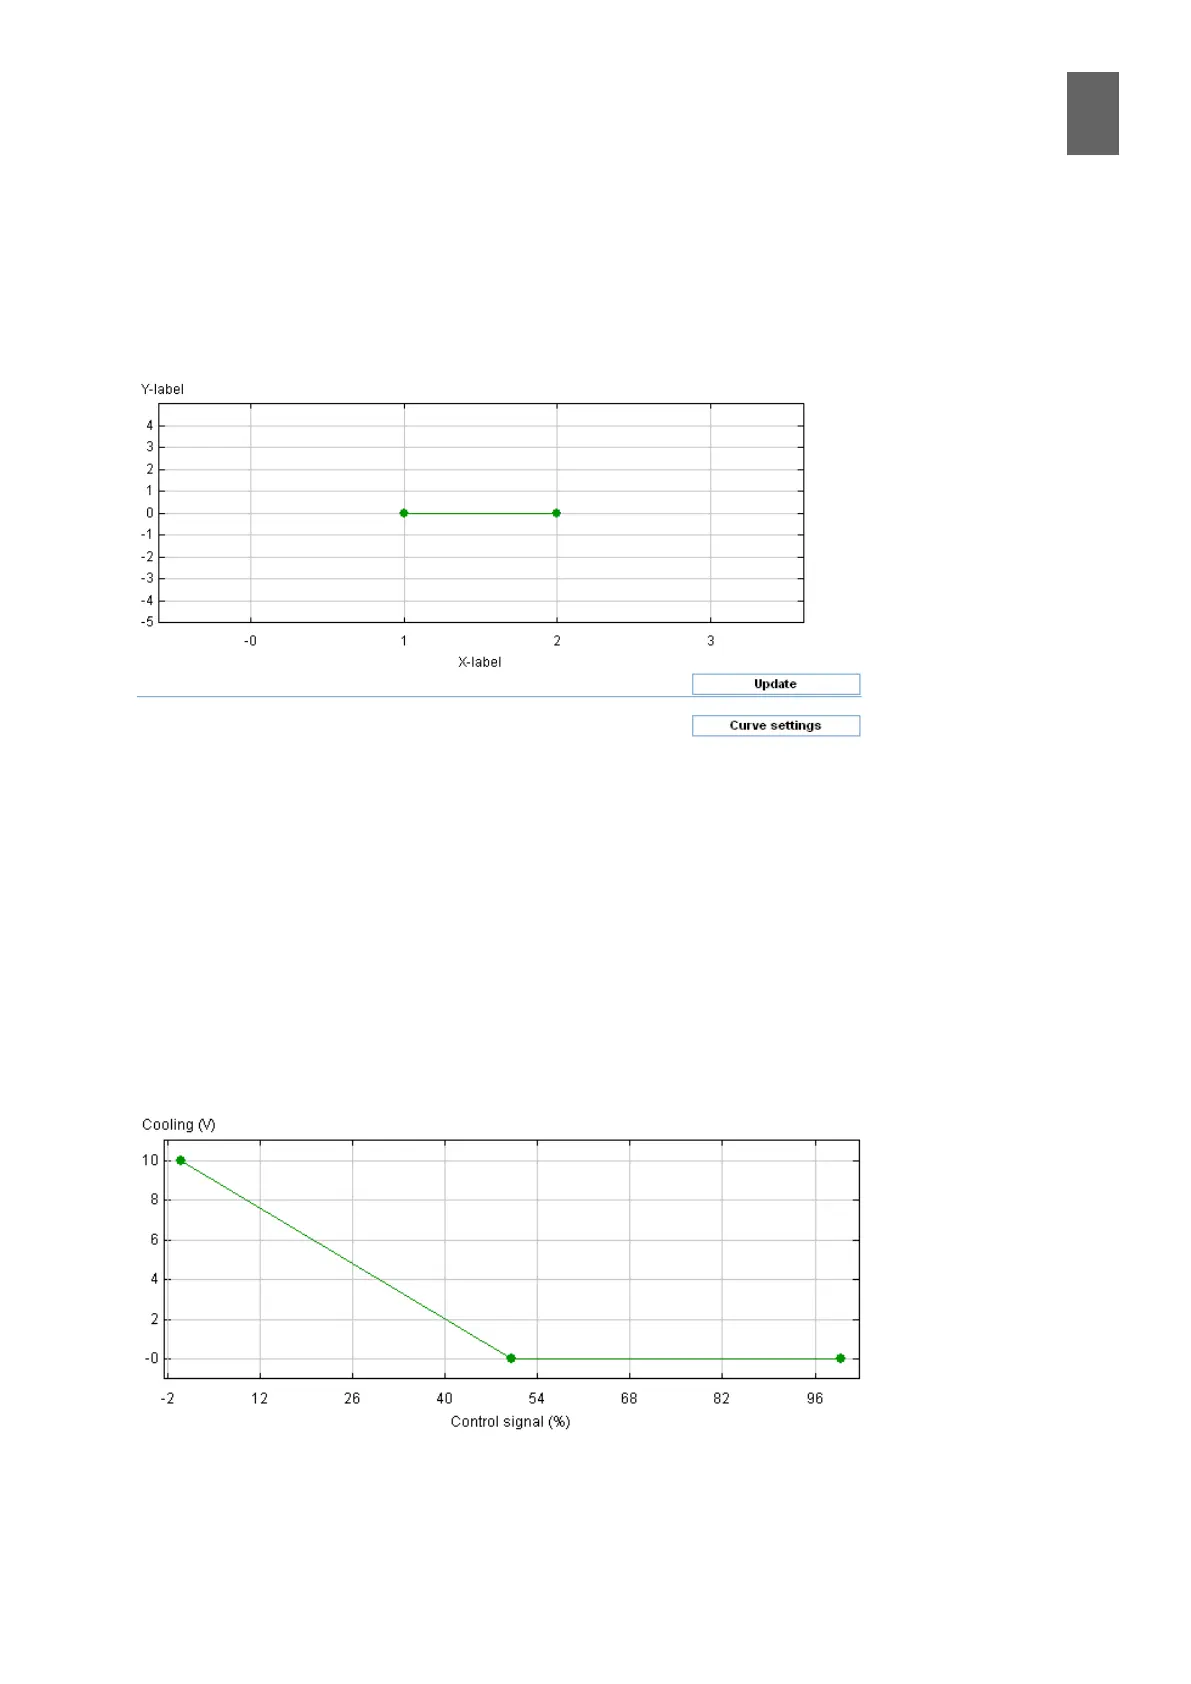
A controller with two actuators in sequence will have two sequence curves. Assume we want the
rst half of the control signal to produce 10—0 V for actuator 1 (Cooling) and the second half 0—10
V for actuator 2 (Heating). Open the curve for sequence 1. Drag the breakpoints to the correct posi-
tions. The chart shows that sequence 1 is 10 V when the control signal is 0, and 0 V when the control
signal is 50%, where it remains until the control signal reached 100%.