8
64
8 - Curves
If you need more breakpoints you can open the curve in the edit window by clicking Curve settings.
Click Save if you have made any changes, then open the curve for sequence 2.
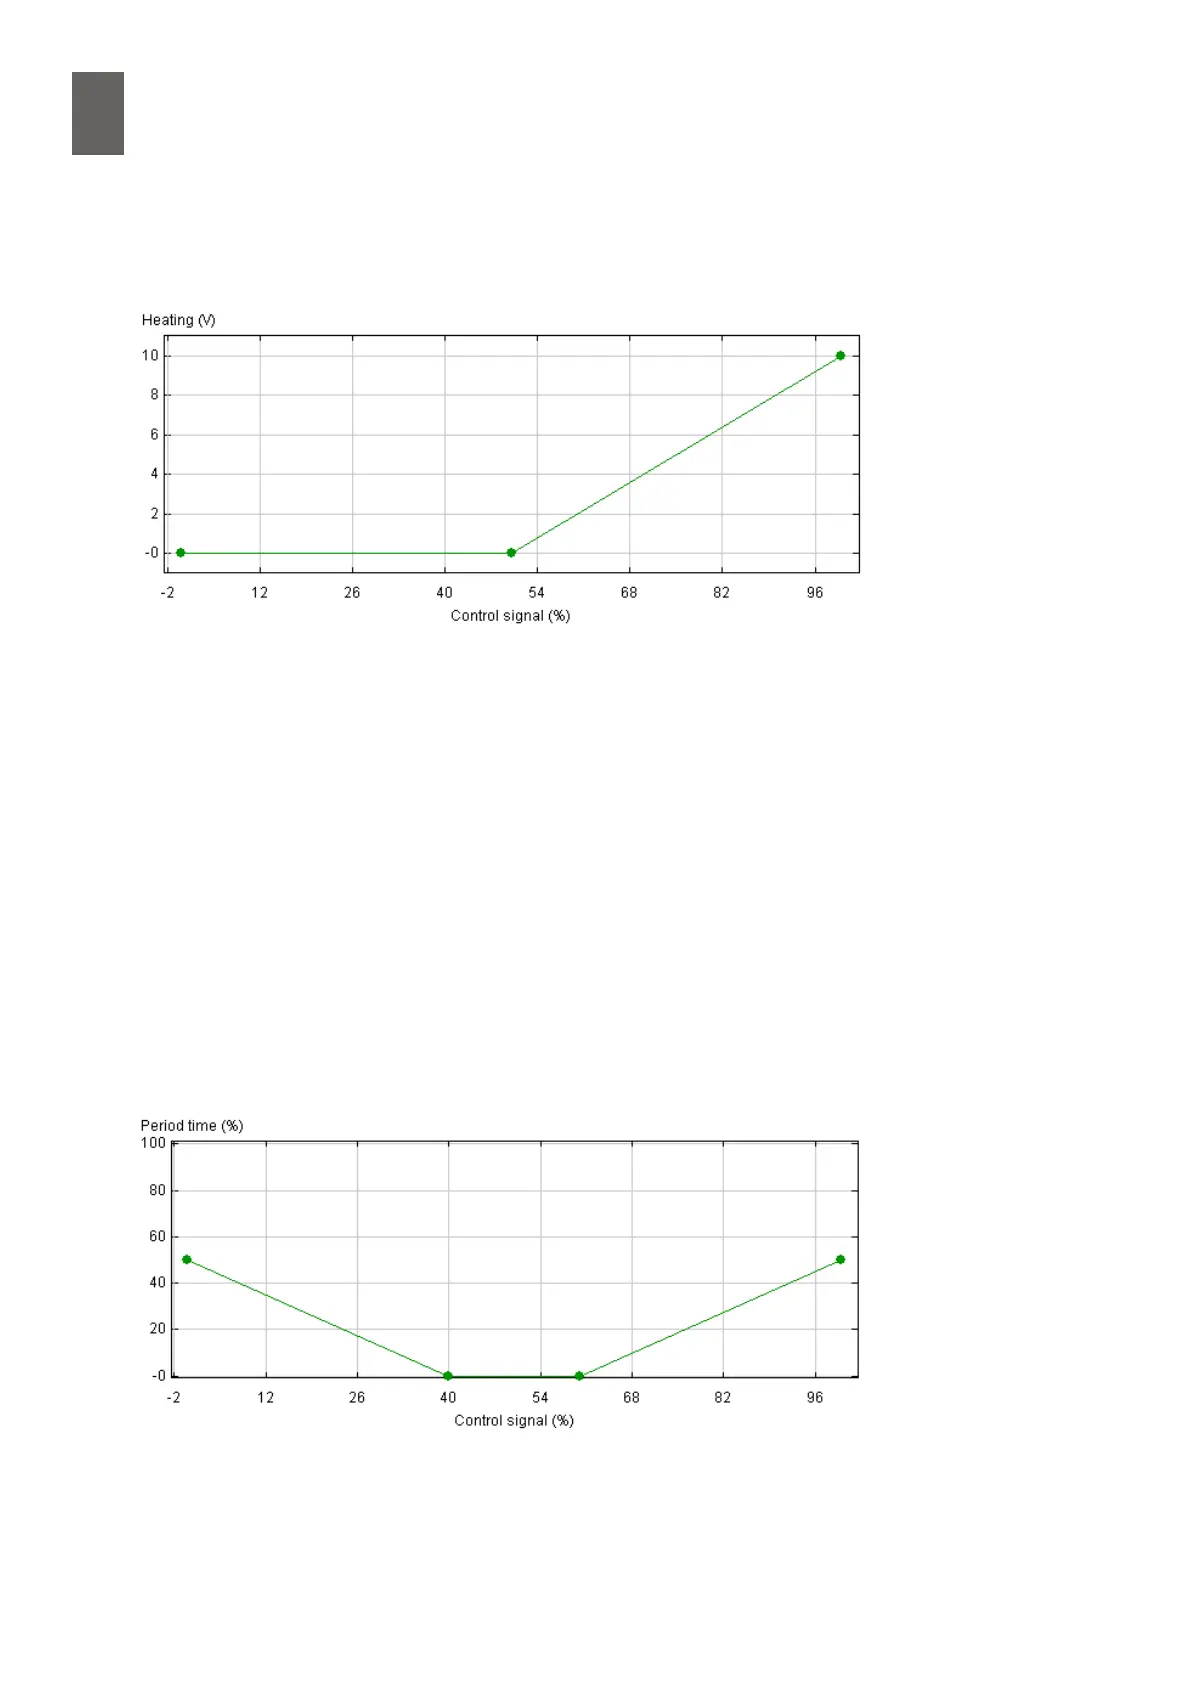
In sequence 2, the output voltage stays at 0 V until the output signal reaches 50%, climbing to 10 V
when the output signal is 100%.
You can easily move the breakpoints around to make the sequences overlap or to create a dead
zone. Always remember to click Save if you have made any changes.
If you chose to display the output signal to the actuator as a percentage instead of volts (V), the Y
axis on the relevant curves will also appear as a percentage.
8�3 Curves for three-state actuators
Curves can also be used to specify the operating parameters for three-state actuators. These actua-
tors are controlled using pulse-width modulation. The period time for PWM is dened in a param-
eter on a special conguration page. The default number of breakpoints is four. Start by dening the
dead zone, then decide the percentage of the period time you want to use for the end positions of
the controller. You can add more breakpoints by clicking Curve settings. This curve has a dead zone
between 40% and 60% of the control signal and 50% modulation at the end positions.