R3131 Spectrum Analyzer Operation Manual
2.2 Basic Operation
2-22 Apr 10/98
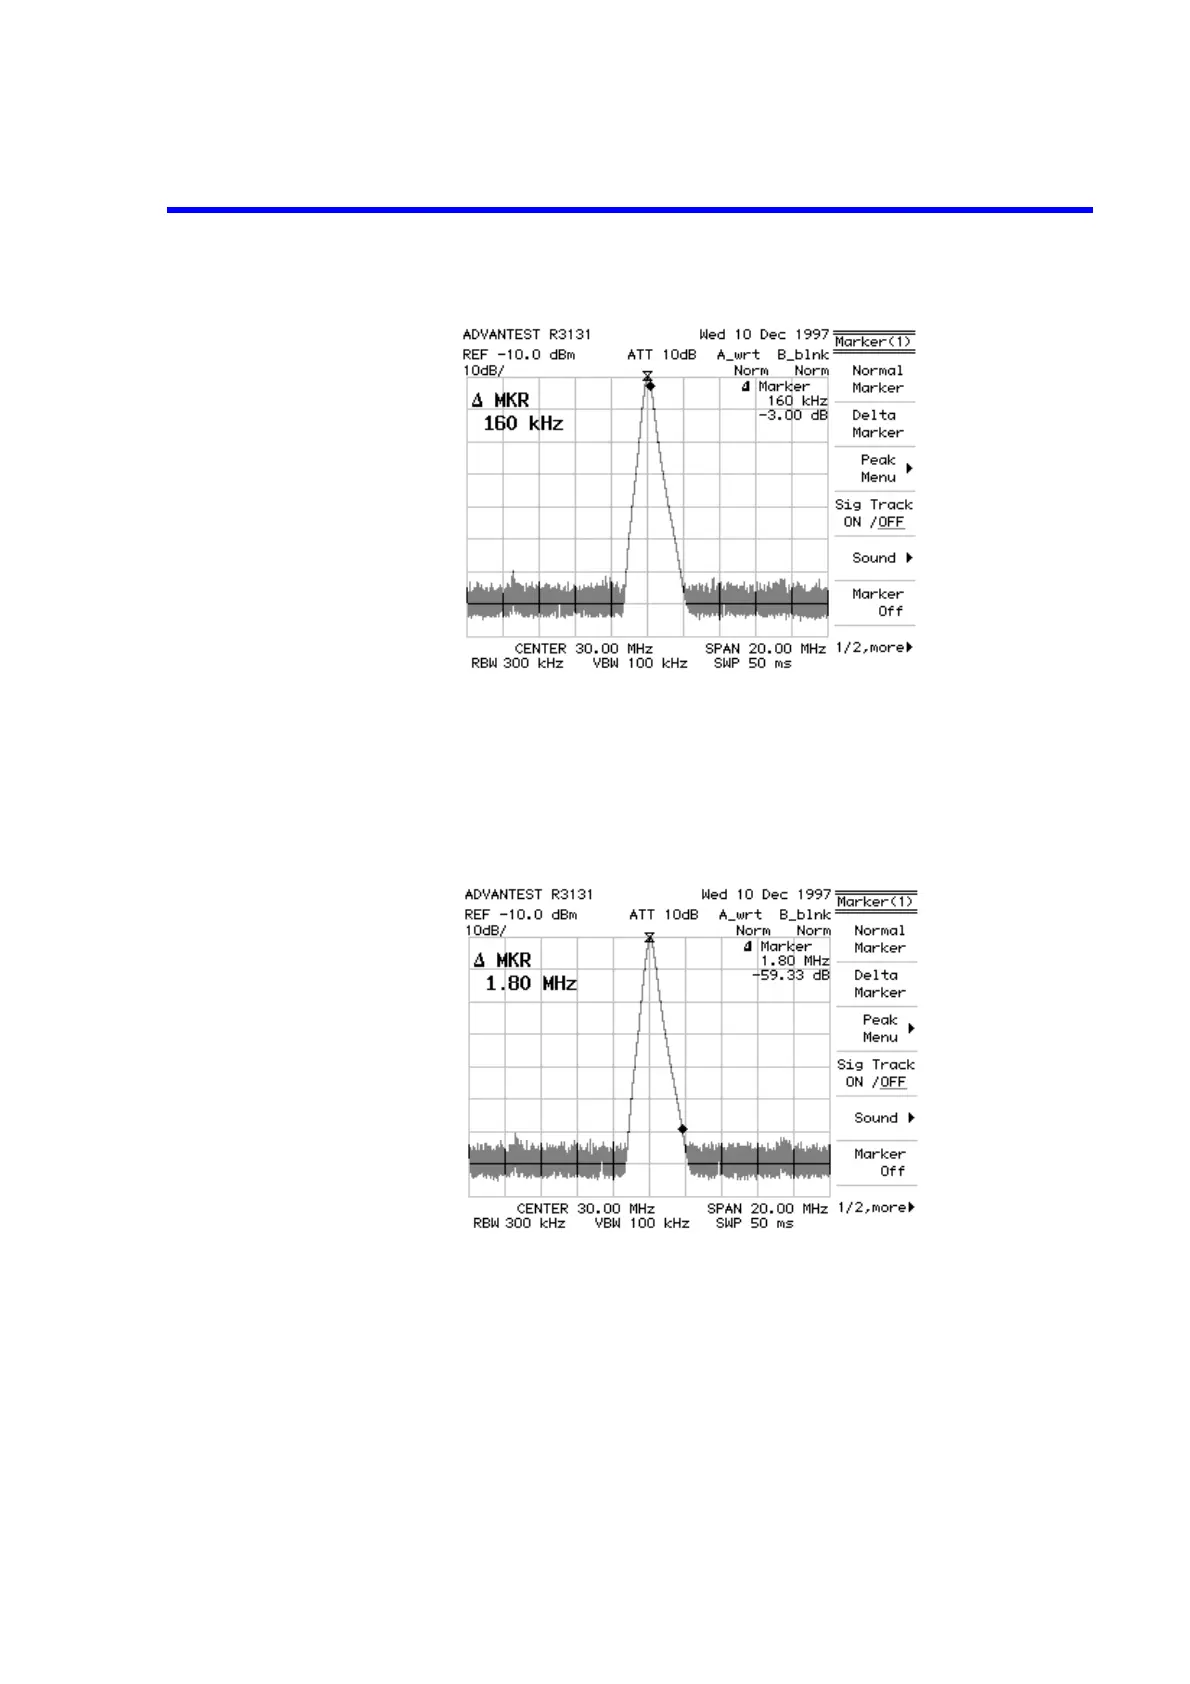
Figure 2-10 Frequency Difference Between the Peak Point and a Point 3 dB Levels Down
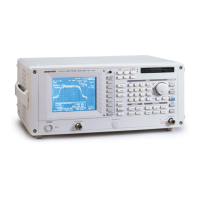
19. Next, move the marker to a point 60 dB levels down from the peak using the data
knob.
The display in the marker area is the frequency difference between the peak point
and a point 60 dB levels down from the peak.
Figure 2-11 Frequency Difference Between the Peak Point and a Point 60 dB Levels Down