356 Appendix E High Resolution Digitizing With the 3458A
In addition to time domain analysis like frequency, risetime, pulse width, and
overshoot, the Wave Form Analysis Library offers frequency domain analysis
with Fast Fourier Transform (FFT) and Inverse Fourier Transform (IFT), with the
Hanning filter function. Further, the Wave Form Analysis Library gives you a
"Fast Scope" program that lets your 3458A and a HP 9000 Series 200/300
computer take measurements up to 50,000 Samples/s and present the data to the
computer display at a refresh rate up to
5/s. In effect, the combination gives you a very high resolution single channel
oscilloscope of 12 MHz bandwidth.
The Wave Form Analysis Library also lets you compare a previously captured
wave form with limits on the measurements to the input signal.
Several utility functions are also provided with the Wave Form Analysis Library:
Format, which formats the output display in engineering units, Intrpo, which
performs a linear interpolation between sample points, Sinc, which performs a
sinc function interpolation between sample points for signals captured near the
Nyquist limit, and Warn58, which prints error and warning messages on the
computer CRT or printer.
As an example, consider how the Wave Form Analysis Library can be used to
capture an AM modulated signal to extract the carrier, the modulation frequency,
and the depth of modulation.
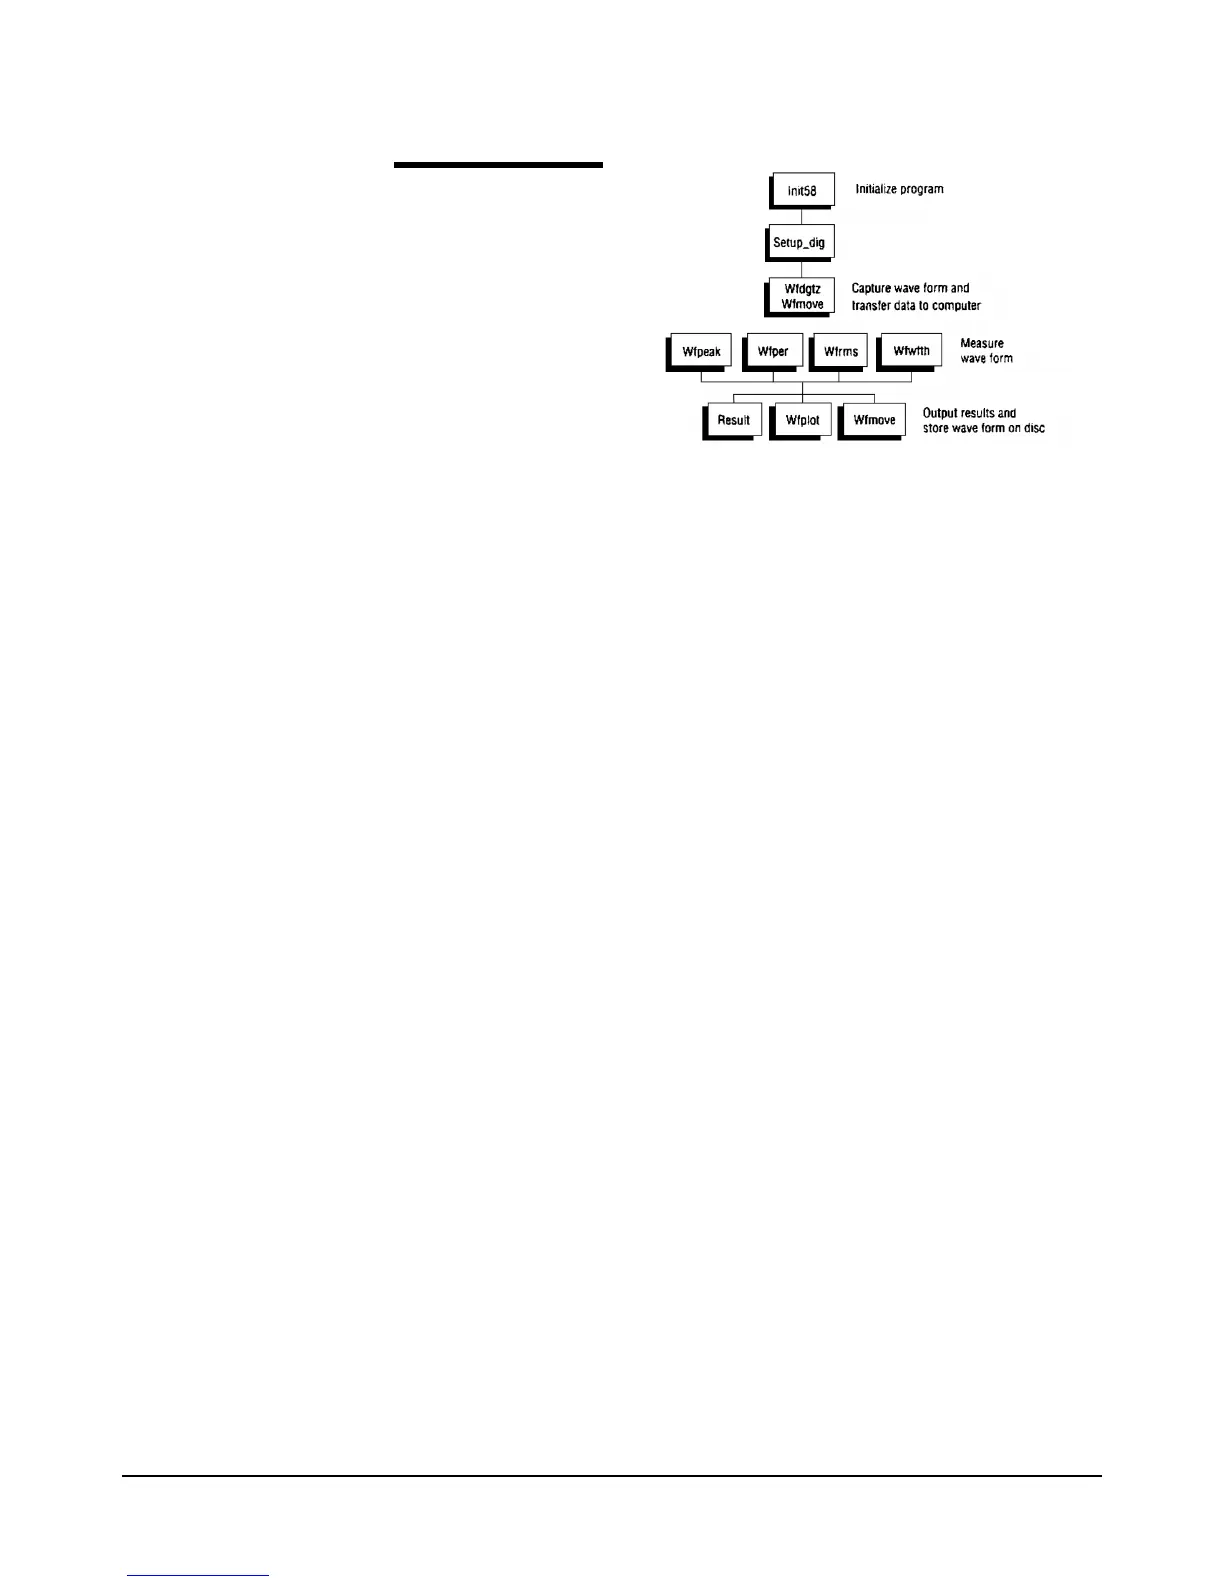
First, the main program must be written to call the library subprograms. The main
program is a block of program code that controls and invokes the subprograms in
the order necessary to solve the measurement problem. The main program can be
short or long depending on the needs of the measurement task. Part of a main
program is shown in below. This program captures a wave form using the 3458A,
transfers the wave form to the computer, and plots the wave form on the computer's
CRT. It uses four Library subprograms: Setup_dig, the dmm setup subprogram
that determines the way you are going to digitize the wave form (DCV, DSAC,
DSDC, SSAC, SSDC), the time interval between samples, and the number of
samples (if you plan on using the FFT or IFT routines, the number of samples
must be a power of two); Wfdgtz, the wave form capture subprogram; Wfmove,
the transfer subprogram; and Wfplot, the plotting subprogram.
1280 CALL Setup_dig(1,1.e-5,1000)
1270 CALL Wfdgtz(1)
1280 CALL Wfmove("1","98",Scal(*),Wavf(*),Clip)
1290 CALL Wfplot(Scal(*),"Wave form 1",Wavf(*),1,1)
Figure 58. Here is a
typical way to structure
your own automatic
measurement program
using the Library
Subprograms (not
necessarily a complete
list).