260-668080-001 Rev 002 March 2013 103
Eclipse Edge User Manual
Ethernet Graphs Screen
On opening, the graphs are blank. To enable, click the Start button. Data aggregates
from this point forward for as long as Portal is logged on, or until the Stop or Clear
buttons are selected.
Viewing other Portal screens does not affect the aggregation of performance
statistics.
The Stop button terminates the data aggregation, but leaves for viewing the data
collected / displayed to that point.
The Clear button clears all data.
If a radio is powered off, or reset, a warning is displayed advising that collected data
has been interrupted.
Data is displayed from right to left in either 1.5 second increments, over a period of
about 1 minute. Performance data or counts are the average/total for each 1.5 second
interval.
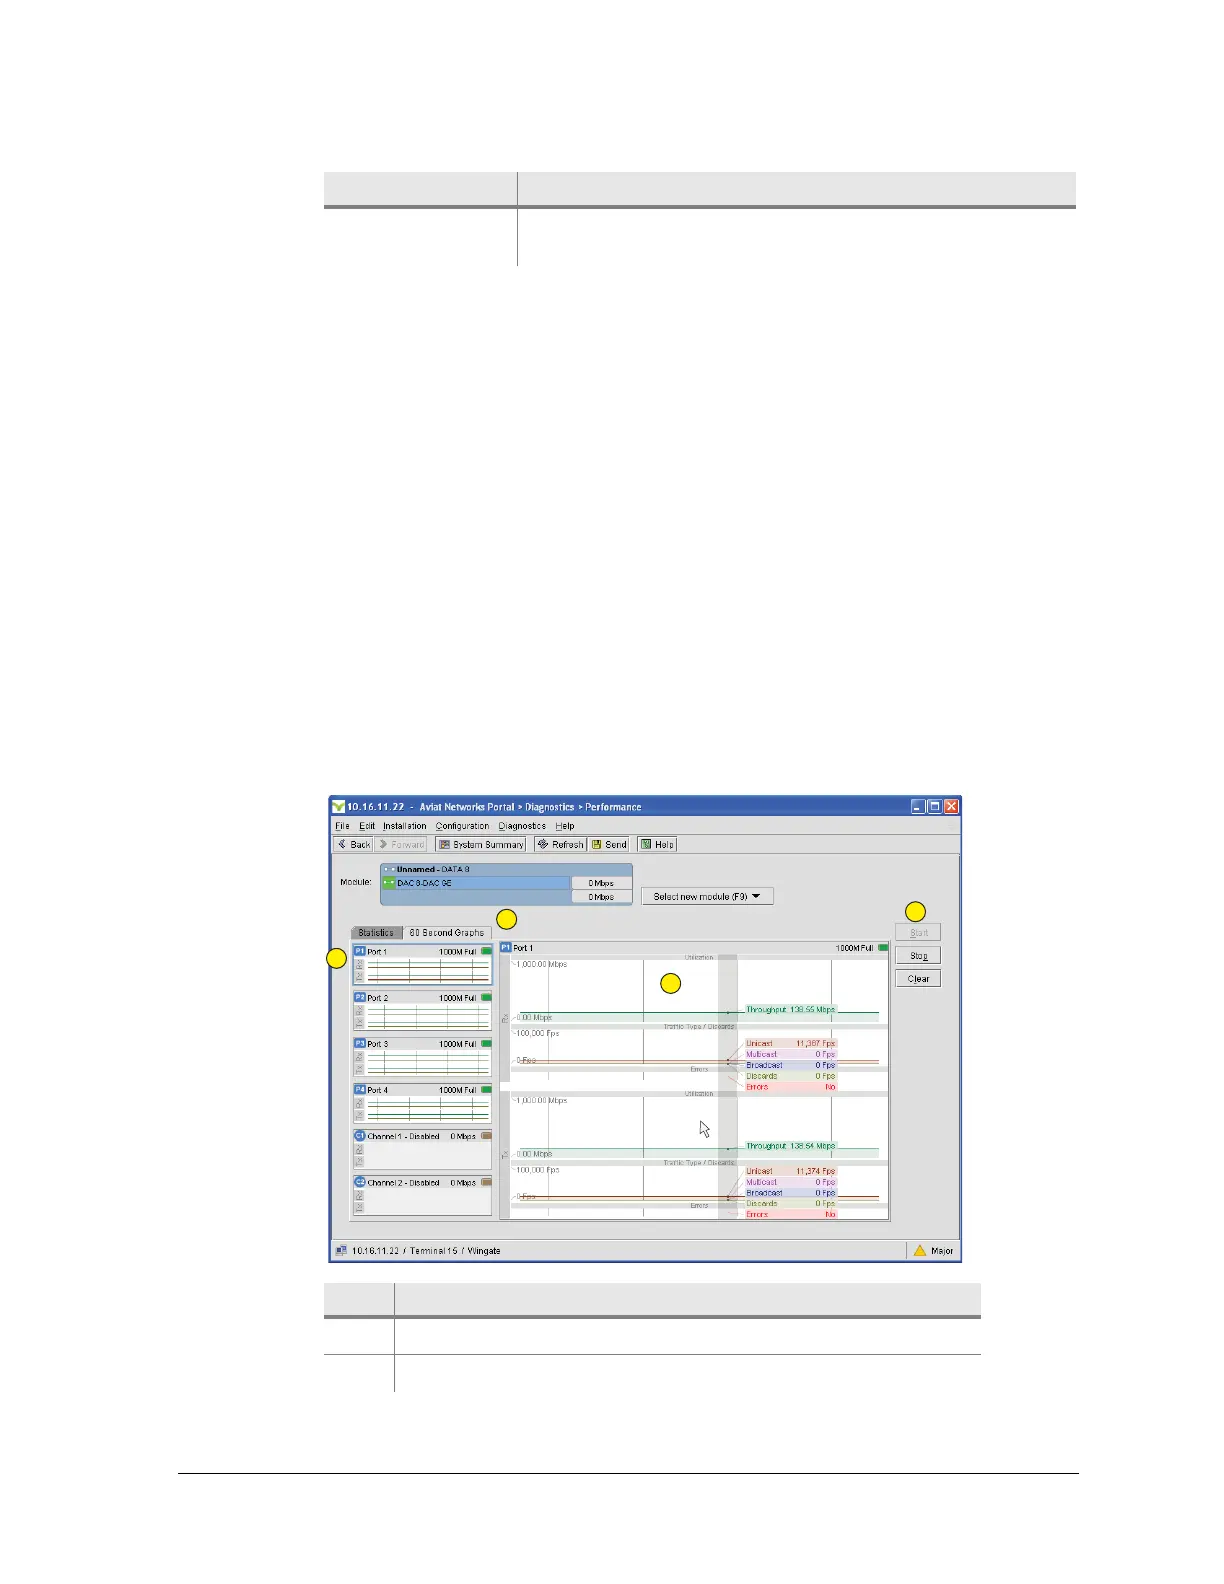
Figure 4-36 shows a Performance screen for a DAC ES.
Figure 4-36. Ethernet Graphs Screen
Switch Stats
Collisions
Total number of collisions during the frame transmission.
Statistic Description
Item Description
1 Graphs screen view selected.
2 Start is selected.