260-668080-001 Rev 002 March 2013 95
Eclipse Edge User Manual
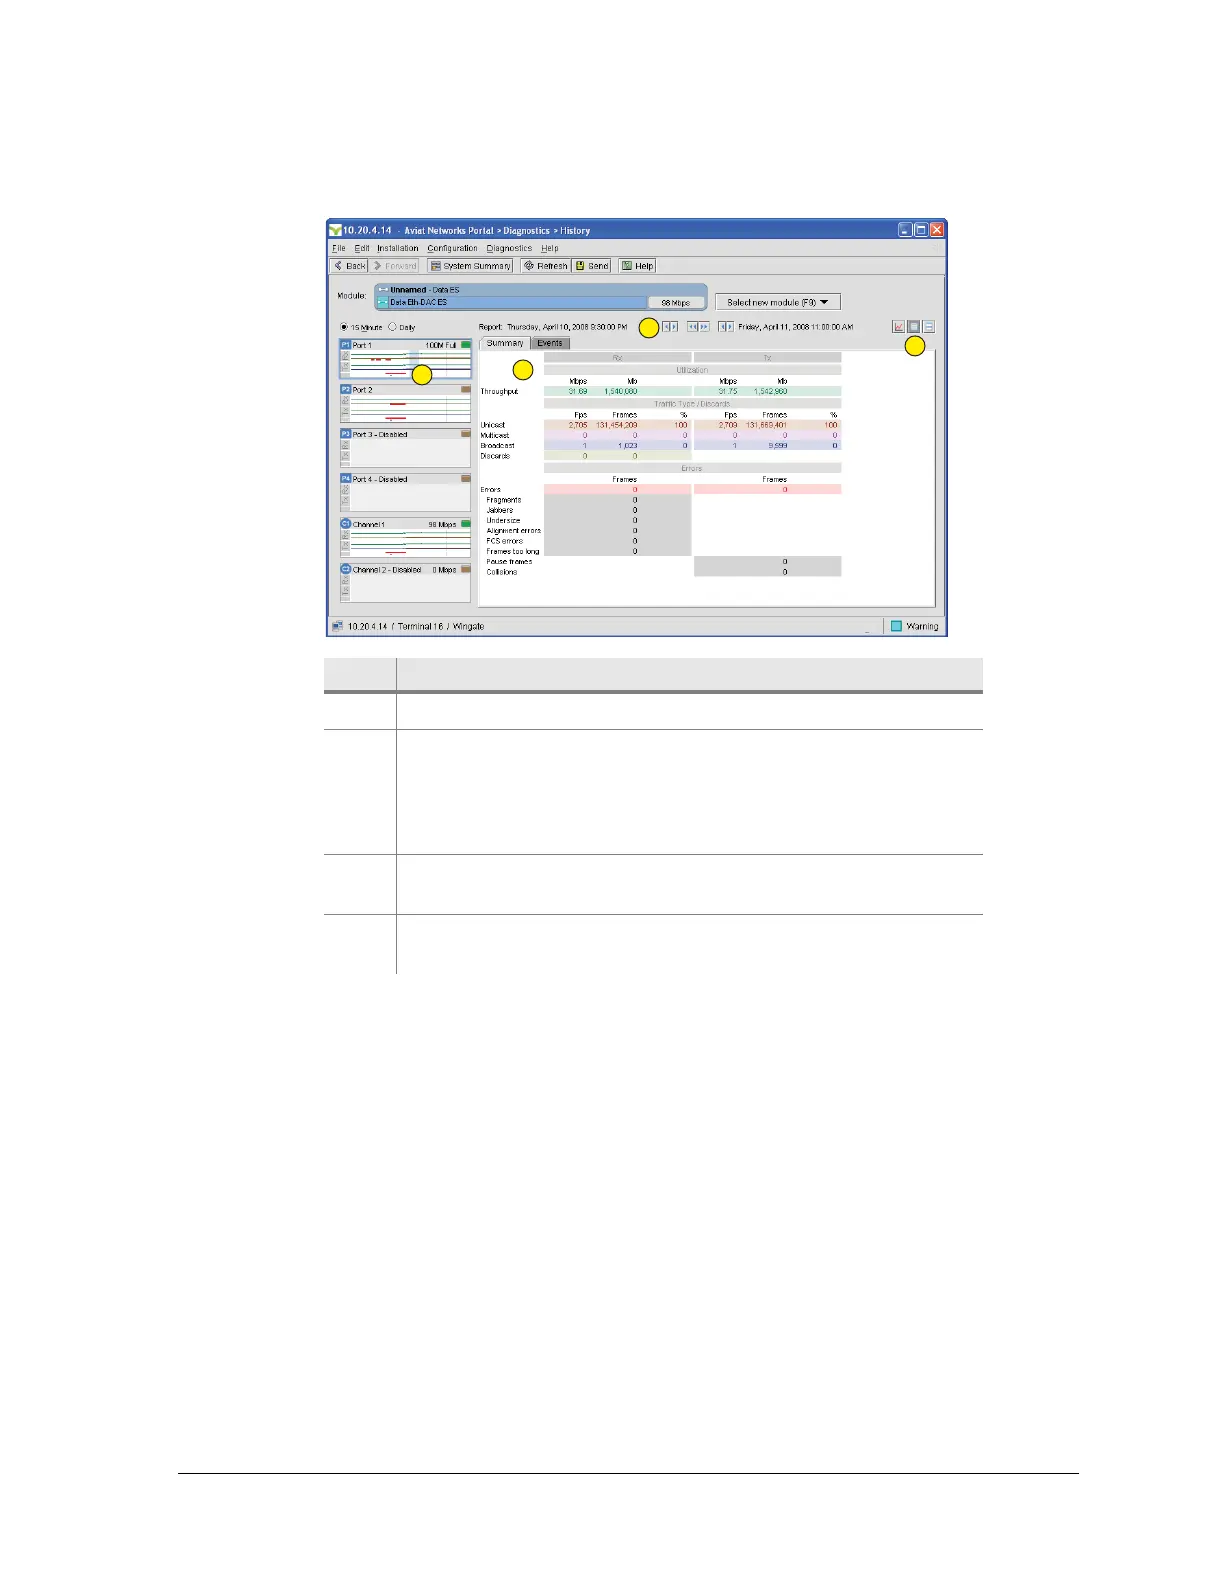
Figure 4-31. History Report Screen: DAC ES
Performance
For Eclipse Edge the Performance screen supports selections of:
• Link Performance on page 95
• Ethernet Performance on page 99
All performance screens include an Export tab, which allows data to be saved to an
Excel compatible CSV file on your Portal laptop. If the CSV delimiter parameter has
not previously been set on your laptop, when the Export tab is first clicked the Edit >
Preferences window will be presented. Refer to Portal Menus on page 27.
Link Performance
The Link Performance screen as shown in Figure 4-32, provides G.826 data for the
link, plus Tx power, RSL, PA temperature, dc supply voltage at the ODU, and an
estimate of current BER and remote fade margin (fade margin at the far-end Rx).
Item Description
1 Report screen view is selected.
2 Report range can be selected using these buttons, or by
clicking and dragging a selection in the Graph detail window.
Mouse over the buttons for a description of their action. The
selected start and end date/times are displayed to each side of
the buttons.
3 The selected range is also indicated in the summary window by
the blue highlighting.
4 Summary Ethernet statistical data is presented for the selected
range.
1
2
3
4