Operation
4-12
HYGROPHIL® F 5673 Operating manual, Software version 1.8.x, 387896MDHEN(14.06.2013)
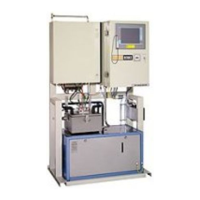
4.3.5.2 Display the history graphic
● After carrying out all required settings for the graphic history mode,
touch .
If the settings are incorrect, a message will appear (see page 4-10).
If the settings are correct, the history graphic is displayed.
Like in the online graphic mode, the curves are marked with different sym-
bols (x, □, ○). As only one scaling is used for the measurement value axis,
the measurement values are multiplied by powers of ten so that they can be
presented within the value range of the measurement value scale.
In the line below the graphic, there is information on the three measurement
value curves presented. The letter “H” at the beginning of this line stands for
„History“ and serves to distinguish this mode from the “Online graphic mode”
(“O“).
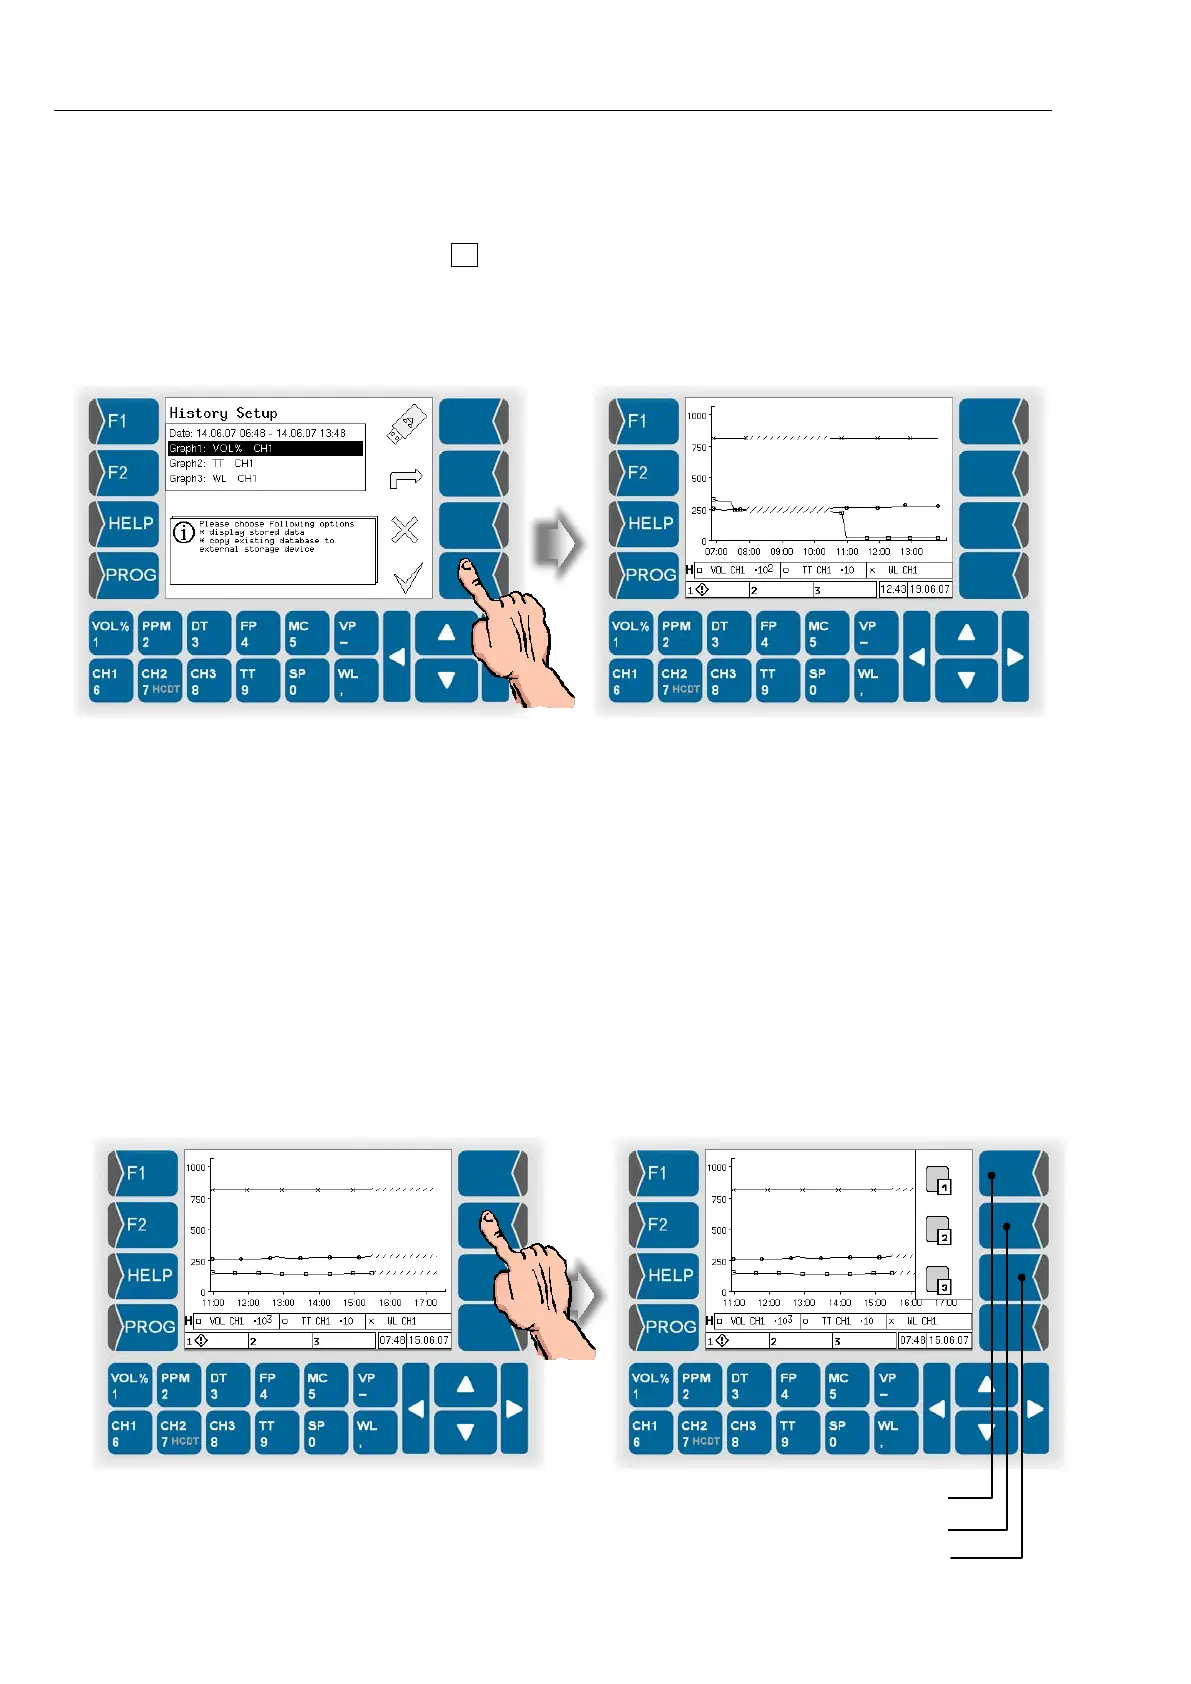
Hide Graphs
By touching the three upper keys right of the display you can hide and recall
each of the graphs.
● Touch one of the keys right of the display. The current functions of theese
keys are displayed.
● Touch the according key to hide or to display one of the graphs.
Hide / display graph 2
 Loading...