In the Display Mode menu you can change the display lay-
out.
Then select the nuclide to be measured:
- If two measuring channels are displayed, press the
Nuclides key first. Then the function of the softkey
changes. Using the keys and you can now set the
and the nuclides separately.
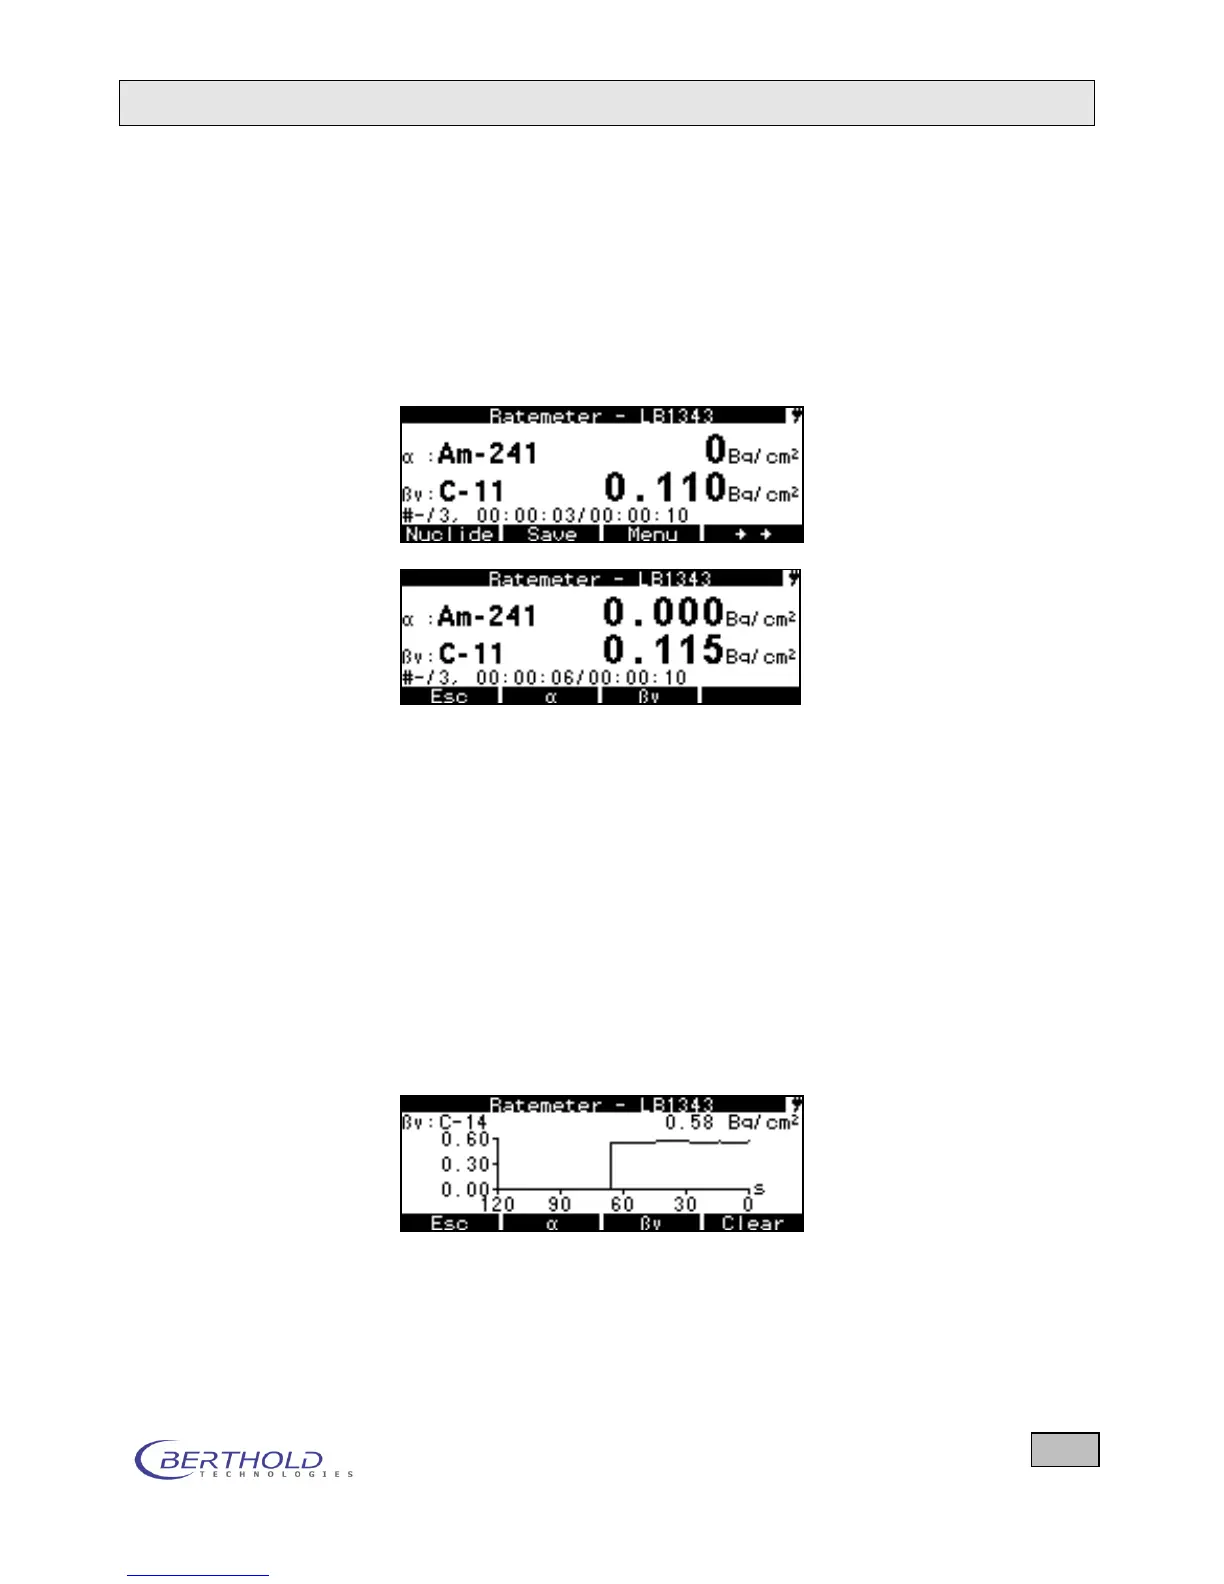
Figure 4.15: Nuclide selection with simultaneous
/
measurement
In the selected measurement mode (Bq/cm²), the detected
count rates (cps) are converted to area activities (Bq/cm²) using
a calibration factor entered in the device. The previously saved
background rate is automatically subtracted, so that the net ar-
ea activities are displayed here.
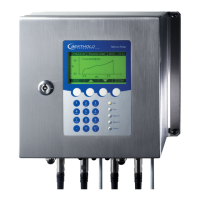
Press the Info softkey to view further information on the ongo-
ing measurement. The Graph function allows you to present
the change of the measured value over time graphically. The
graph runs from right to left and you always see the values of
the last 120 seconds. With Delete the graph can be reset and it
starts all over again. In the counter/timer mode we get a new
pixel in the graph for each elapsed cycle.
Figure 4.16: Change in the -values over time displayed as a
graph