Value Description
Flow bar
graph
Displays the flow during treatment.
• To the left of the bar, a mark discloses the highest flow during
last breath.
Volume bar
graph
Displays the air volume delivered during treatment.
• To the left of the bar a mark discloses the total volume delivered
during last breath.
• To the right of the bar marks discloses the set target volume value
(if used).
• Red lines in the bar indicates alarm levels
In clinical mode, curves, trends and additional values can be viewed from the Patient Moni-
tor page, see .
5.9 The Menu
This section contains information about the menu and the menu items.
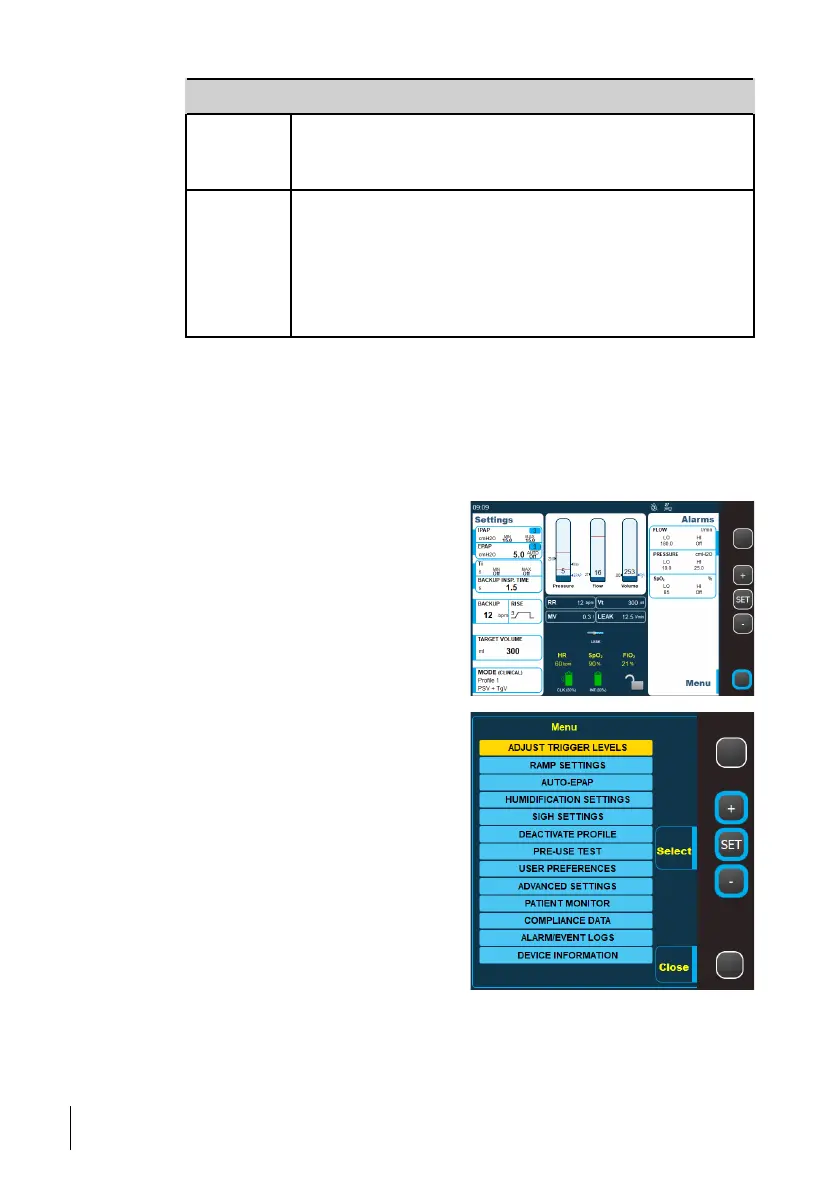
Opening the Menu
1 Press the Menu button.
2 In the menu, use the + and - buttons to
select the item to open and then press the
Set button to open it.
Note that only menu items applicable for
the current mode are available.
5.9.1 Humidification Settings
This menu item lets you make changes to the humidifier and the heated circuit settings.
56
How to Use the Nippy 4
User Manual
Doc. 006553 M-6